
Figure 1.
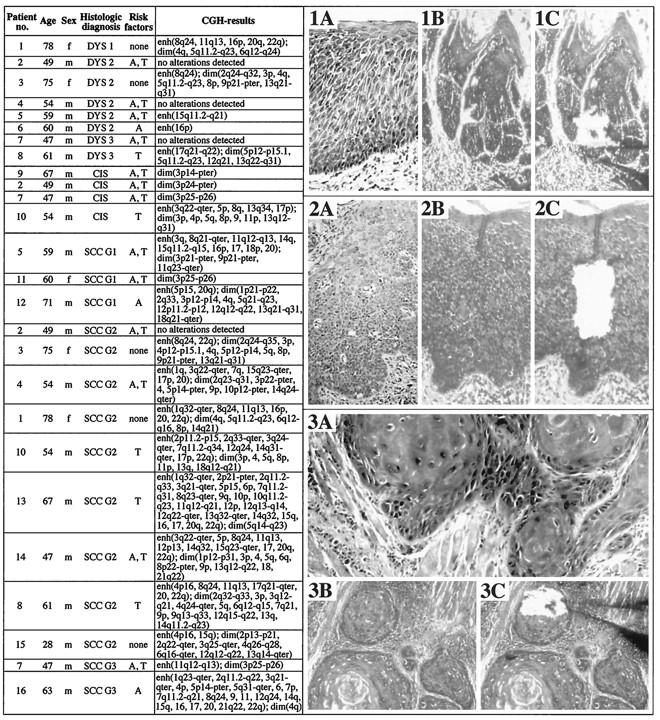
Left: Summary of selected clinical data, histopathological characteristics, and CGH results in dysplasias, CIS, and OSCCs investigated. m, male; f, female; DYS 1, mild dysplasia; DYS 2, moderate dysplasia; DYS 3, severe dysplasia; G1, G2, and G3, grades 1, 2, and 3, respectively; A, alcohol consumption (as defined in Materials and Methods); T, tobacco consumption (as defined in Materials and Methods); enh, enhanced number of chromosomes or chromosome segments; dim, reduced number of chromosomes or chromosome segments. Right: Covered H&E-stained tissue sections of oral biopsies representative of a dysplasia (1A), a CIS (2A), and a SCC (3A) viewed through a brightfield microscope used for diagnosing the lesions (magnification, ×100). Noncovered H&E-stained tissue sections before (1B, dysplasia; 2B, CIS; 3B, SCC) and after (1C, dysplasia; 2C, CIS; 3C, SCC) microdissection viewed through an inverted microscope used for microdissection (×100). The tip of a glass needle can be seen in images (1C) and (3C).