
Figure 3.
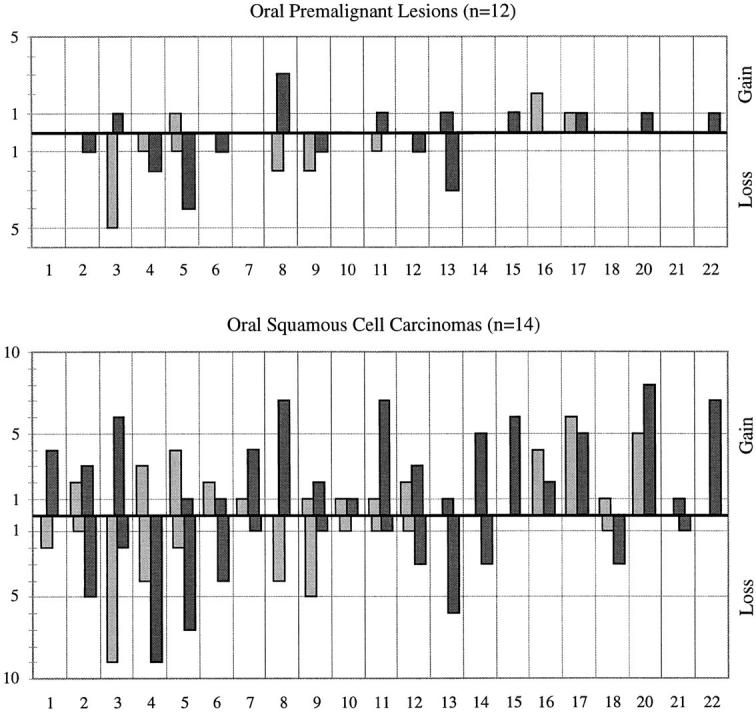
Frequency of all CGH results obtained in OPLs (top) and OSCCs (bottom). x axis, chromosomes 1–22; y axis, number of cases. Ascending bars represent gains on the short arms (light bars) or long arms (dark bars), whereas descending bars represent losses on the short arms (light bars) or long arms (dark bars) of the respective chromosomes.