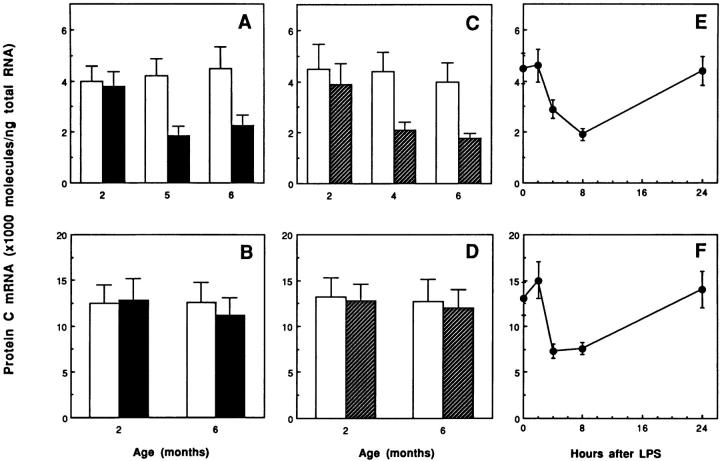
Figure 4.
Changes in PC mRNA levels in the kidneys and livers of mice with renal disease. Total kidney and liver RNAs were extracted from female MRL lpr/lpr mice and their controls (MRL +/+) at 2, 5, and 6 months of age; from male db/db mice and their normal counterparts (C57BL/KsJ +/?) at 2, 4, and 6 months of age; and from control (0 time point) and LPS (50 μg)-treated normal CB6 mice at 2, 4, 8, and 24 hours after injection. PC mRNA was determined using quantitative RT-PCR analysis as described in Materials and Methods. A and B: Kidneys (A) and livers (B) from control (open bar) and female MRL lpr/lpr (closed bar) mice. C and D: Kidneys (C) and livers (D) from control (open bar) and db/db (hatched bar) mice. E and F: Kidneys (E) and livers (F) from LPS-treated mice. Data are means (bars, SD) of three different experiments.

