

Abstract
The soluble β-chymases mouse mast cell protease-1 (mMCP-1) and rat mast cell protease-II are predominantly expressed by intestinal mucosal mast cells (IMMCs) and may promote mucosal epithelial permeability when released during intestinal allergic hypersensitivity responses. To study the function of these chymases, we generated mice with a homozygous null mutation of the mMCP-1 gene and investigated their response to infection with the intestinal nematode Nippostrongylus brasiliensis. Whereas mMCP-2, -4, and -5 were transcribed normally, there was no transcription of the mMCP-1 gene in null (−/−) mice, nor was mature mMCP-1 protein detected in (−/−) jejunal mucosa. In contrast, levels of mMCP-1 in wild-type (+/+) jejunal mucosa increased 200- to 350-fold from 0.66 μg mMCP-1/g wet weight in uninfected mice to 129 and 229 μg/g wet weight on days 8 and 10 of infection, respectively. The kinetics of IMMC recruitment differed in −/− mice compared with +/+ controls on days 8 (P < 0.05) and 10 (P < 0.03) of infection. The IMMCs in infected −/− mice stained poorly, if at all, for esterase with naphthol AS-D chloroacetate compared with the intense staining observed in +/+ controls. Ultrastructurally, the prominent crystal intragranular structures that are found in intraepithelial +/+ IMMCs were absent from −/− IMMCs. These data show that disruption of the mMCP-1 gene leads to profound histochemical and ultrastructural changes in IMMC granules.
Intestinal mucosal mast cells (IMMCs) in the mouse are distinguished from connective tissue mast cells (CTMCs) by their predominantly intraepithelial localization and unique fixation, by their histochemical and morphological properties, 1,2 and by their content of granule chymases. 1,3 Compared with other mammalian species, including rat, sheep, and human, in which IMMCs are relatively abundant and located in the lamina propria, 4-6 IMMCs in mice are rare unless the animal has recently harbored an intestinal nematode infection. 1,3 At about the time of the immunological expulsion of intestinal nematodes, there is substantial IMMC hyperplasia in murine rodents and ruminants, as well as in other species, including guinea pigs and gerbils. 7,8 Hyperplasia of IMMCs has also been described in parasitized humans, 9 and this type of response may be common to most mammalian species infested with nematodes, suggesting that mast cells play a role in the extensive immunopathology associated with intestinal nematodiasis. 4,6
The hyperplasia and differentiation of IMMCs in response to nematode infection is highly T-cell dependent, and in murine rodents the ligand for c-kit, stem cell factor (SCF), plays a key role in nematode-induced IMMC hyperplasia. 10,11 Studies of parasitized rodents and sheep have shown that IMMCs express soluble chymases that, at about the time of the immunological expulsion of the parasites, are secreted systemically into the bloodstream and across the epithelium into the gut lumen. 4 It is likely, therefore, that granule chymases serve a functional role in the protective response against gastrointestinal helminth parasites. It is probably significant that >95% of IMMCs in mice, and 40 to 50% of IMMCs in rats and sheep, are located intraepithelially at the time of worm elimination, because this would facilitate the access of secreted chymases to the epithelial tight junctions 4,12 and, possibly, to protease-activated receptors on the enterocytes. 13 There are, therefore, several mechanisms by which IMMCs could alter epithelial function or integrity.
In rodents, the soluble β-chymases mouse mast cell protease-1 (mMCP-1) and rat mast cell protease-II (rMCP-II) are abundantly expressed by IMMCs; are 74% homologous at the amino acid level with net charges of +3 and +4, respectively 14 ; and probably, therefore, serve similar functions in vivo. The introduction of rMCP-II into the perfused mesenteric artery of normal rats is associated with rapid development of intestinal mucosal permeability. 12 Similarly, systemic challenge with worm antigen in rats sensitized by previous infection is associated with immediate and substantial release of rMCP-II into the gut lumen and is accompanied by the translocation of plasma proteins across the intestinal epithelium. 12 One of the major functions of these soluble β-chymases is, therefore, to promote mucosal permeability in intestinal allergic hypersensitivity reactions. However, it is also likely that these abundant chymases serve other as yet undefined functions. To address the functions of these β-chymases more directly, we have used a targeting strategy to generate mice lacking a functional mMCP-1 gene. Our results suggest that mMCP-1 plays a role in the regulation of mast cell hyperplasia during nematode infection and that its absence is associated with altered size and internal structure of IMMC granules.
Materials and Methods
Construction of the mMCP-1 Targeting Vector
Using a full-length cDNA clone for mMCP-1 as a template, a 100-bp probe was generated by polymerase chain reaction (PCR) using primers that amplified a 100-bp region of the 5′-untranslated region of mMCP-1 to minimize the possibility of inadvertently isolating clones from related protease genes. 14 The probe was labeled with digoxigenin (DIG) (Boehringer Mannheim, Lewes, UK) in the PCR and used to isolate a full-length genomic clone from a 129-strain mouse genomic λ-library. This clone was mapped and consisted of a 15-kb fragment containing the mMCP-1 gene with extensive 5′ and 3′ flanking regions. A combination of DNA sequencing and Southern blotting was used to confirm the identity of the mMCP-1 clone. A 4.35-kb PvuII-HindIII and 3.9-kb HindIII-SalI restriction fragment incorporating the 5′ and 3′ flanking regions of the mMCP-1 gene was cloned into pSP72 (Promega, Southampton, UK). A 4.8-kb fragment containing all five exons of the mMCP-1 gene itself was replaced in the above construct by a neo gene driven by a human β-actin promoter and including an SV40 polyadenylation signal, 15 to form the targeting vector.
Electroporation, Selection and Screening of Embryonic Stem Cells, Blastocyst Injection, and Production of Chimeras
The targeting vector was linearized by HindIII digest and electroporated into 129 strain mouse embryonic stem (ES) cells. Linearized DNA was added to 9.0 × 10⁷ E14 Tg2A ES cells and exposed to a 0.8-kV 3.0-μF pulse and plated out at 5 × 10⁶ cells/100-cm Petri dish. Cells were subjected to selection by G418 (175 μg/ml) on days 1, 3, 5, 7, and 9. Resistant clones containing the correct targeting event were identified by Southern blotting using two external screening probes (Figure 1A) ▶ . After homologous recombination an endogenous EcoRI fragment was converted from a 12-kb fragment to a 10.2-kb fragment detected by the first probe (A) because of the substitution of the five exons of mMCP-1 with the neo cassette. The replacement event was confirmed using a second probe (B) to detect generation of a 9.1-kb EcoRI fragment. All confirmed clones were analyzed with a third probe derived from the neo cassette to ensure single integration events. The frequency of correctly targeted clones was 5 out of 192 (2.6%). Targeted ES cell clones were separately microinjected into blastocysts collected 3.5 days postcoitum from C57BL/6 mice and implanted into C57BL/6 × CBA pseudopregnant foster females 2.5 days postcoitum. ES cell-derived progeny identified by coat color were screened by Southern blot analysis and long-template PCR (LT-PCR) to detect the correct targeting event, and targeted progeny were backcrossed with MF-1 strain mice.
Figure 1.

A: The targeting construct. Top: Wild-type allele; genomic structure and partial restriction map of the mMCP-1 gene. Exons are represented by solid boxes, and the length of the diagnostic EcoRI restriction fragments (solid lines) and probes used for Southern blot analysis are shown, in addition to primers used for LT-PCR and expected sizes of the PCR products (dotted lines). Middle: Targeting vector with homology regions of 3.9 kb on the 5′ side and 4.2 kb on the 3′ side of the neo gene and pSP72 vector. Bottom: Targeted allele; predicted structure of the targeted mMCP-1 locus. All five exons have been deleted and replaced by the neo gene driven by its own promoter. Again, the diagnostic EcoRI restriction fragments and probes used for Southern blot analysis of correct recombinants are shown. B: Screening progeny by LT-PCR. Example of a Southern blot of LT-PCR products generated from genomic tail-snip DNA of MF1 mice derived from a heterozygote cross. Primers P1 and P2 amplify wild-type alleles to give a product of 5 kb, whereas primers P1 and P3 amplify targeted alleles to give a product of 7.3 kb; details can be found in (A). The PCR products were hybridized with the DIG-labeled 147-bp region within probe B. PCR products are shown from a wild-type (+/+), a heterozygote (+/−), and a homozygote (−/−) mouse.
Screening Progeny by LT-PCR
Genomic DNA was prepared by phenol/chloroform extraction 16 and amplified using LT-PCR (Boehringer Mannheim). The positions of the primers used are indicated in Figure 1A ▶ . Two pairs of oligonucleotide primers were used: primers P1 and P2, which amplify the wild-type mMCP-1 allele to give a product of 5 kb, and primers P1 and P3, which amplify the correctly targeted allele to give a product of 7.3 kb. Primer sequences were as follows: 5′-TGAGCAGGTGGAGACTCCTGATAGT-3′ (P1), 5′-AGCTCTCTGGTACTCTTTGGTTCA-3′ (P2), and 5′-TGCATTAATGAATCGGCCAACGCGC-3′ (P3). 14 Reactions were carried out in 50-μl volumes in thin-walled 0.2-ml tubes (Perkin Elmer MicroAmp; Perkin Elmer Corp., Norwalk, CT) containing 20- to 100-ng template DNA, 350 μmol/L deoxynucleotide triphosphates, 300 nmol/L of each primer, 1× Boehringer Mannheim Expand PCR buffer (50 mmol/L Tris-HCl pH 9.2, 16 mmol/L (NH4)2SO4, 1.75 mmol/L MgCl2), and 3.5 U Taq/Pwo enxyme mix. After an initial denaturation step for 2 minutes at 94°C, the DNA was amplified for 10 seconds at 94°C, 30 seconds at 65°C, and 4 minutes at 68°C for 10 thermocycles, followed by 10 seconds at 94°C, 30 seconds at 65°C, and 4 minutes at 68°C, with the latter step extended by 20 seconds at each cycle for 20 thermocycles and a final elongation step of 7 minutes at 68°C. The PCR products were analyzed on 1% agarose gels.
The level of detection was increased and the authenticity of the PCR products was confirmed by Southern hybridization with a DIG (Boehringer Mannheim)-labeled cDNA probe specific for a region within probe B, 3′ of the targeted construct and common to LT-PCR products from both alleles, without including LT-PCR primer sequences. The cDNA probe was amplified and DIG labeled by PCR of a 147-bp fragment using a probe B cDNA clone as a template and substitution of deoxynucleotide triphosphate with DIG-11-deoxyuridine triphosphate labeling mixture in the PCR (Boehringer Mannheim). Primers were 5′-ACATGCATAAGAATAAACACTGTGG-3′ and 5′-ACAGGTTTAATGGCTTCCAGAAAGG-3′. For Southern detection the DIG-labeled probe was denatured at 95°C (10 minutes), chilled on ice, and hybridized at 20 ng/ml in a total volume of 10 ml Rapidhyb (Amersham, Rainham, UK) hybridization buffer/membrane. After hybridization for 3 hours, membranes were washed at high stringency (65°C in 0.1× standard saline citrate/0.1% sodium dodecyl sulfate). Hybridized probe was detected with anti-DIG alkaline phosphatase antibody using colorimetric detection with 5-bromo-4-chloro-3-indolyl phosphate/nitroblue tetrazolium. The LT-PCR products detected by Southern hybridization from a typical wild-type (mMCP-1+/+) homozygote (mMCP-1−/−) and heterozygote (mMCP-1+/−) mouse are shown in Figure 1B ▶ .
Parasite Infections and Tissue Preparation
The mouse-adapted strain of Nippostrongylus brasiliensis (generously supplied by Dr. J. Urban) was maintained by alternate passage through BALB/c and Swiss White strains of mice and charcoal cultures as described previously. 17 Null (mMCP-1−/−) mice and MF-1 (mMCP-1+/+) controls were infected with 500 N. brasiliensis L3, and infection was monitored by fecal egg counts. Mice were killed by exsanguination under terminal anesthesia, and small (<1 cm) samples of jejunum were immediately snap frozen in liquid nitrogen for RNA analysis, and on dry ice for immunoassay of mMCP-1, and stored at −70°C before extraction. Two separate but adjacent samples of jejunum approximately 6 to 8 cm long were taken 2 to 3 cm distal to the ligament of Trietz, and worms were counted in situ using a dissecting microscope after opening and flattening the intestine onto stiff blotting paper. After counting, the jejunum was gently lifted off the paper and rolled with villi outermost onto the tip of a plastic pipette (pastette) and immediately transferred to Carnoy’s fluid or 4% paraformaldehyde dissolved in phosphate-buffered saline (PF/PBS) as described previously. 17,18 Samples of ear pinnae from the same mice were also snap frozen or fixed in Carnoy’s fluid or PF/PBS. After fixation for 6 hours in PF/PBS or overnight in Carnoy’s fluid, the tissues were transferred to 70% ethanol and stored at 4°C for a minimum of 24 hours before trimming, processing, and embedding in paraffin wax. Similar procedures for collecting jejunum were followed for uninfected (control) mice.
Detection of Transcripts by Reverse Transcription-PCR
Total RNA was extracted from snap-frozen ear pinnae and jejunum by maceration in 1 to 2 ml of Tri-Reagent (Sigma, Poole, UK) with a mortar and pestle precooled to −70°C as described previously. 18 The quantity and quality of the total RNA was determined by measurement of the absorbance at 260/280 nm in a Beckman DU 650 spectrophotometer.
Because mast cell-associated heparin can copurify with RNA and is known to inhibit the PCR reaction, RNA samples were treated with heparinase before reverse transcription (RT). 19 Aliquots of 4 μg RNA were incubated with 4 U heparinase I (Sigma) in 5 mmol/L Tris-HCl pH 7.5, 1 mmol/L CaCl2, and 40 U RNase inhibitor (Promega) in a total volume of 40 μl for 2 hours at 25°C. Serial dilutions of the heparinase-treated samples were reverse transcribed in 20-μl volumes containing 1, 0.1, or 0.01 μg RNA, 1 mmol/L deoxynucleotide triphosphates, 20 U RNase inhibitor, 2.5 μmol/L (dT) is oligonucleotide primers, 1× RT buffer, and 2.5 mmol/L MgCl2; 50 U of avian myeloblastosis virus reverse transcriptase reaction was diluted to 100 μl, and 10 μl were used for each PCR reaction. The cDNA was amplified for 1 minute at 94°C, 2 minutes at 63°C, and 3 minutes at 72°C for 30 thermocycles in 50-μl volumes in thin-walled 0.2-ml tubes (Perkin Elmer MicroAmp) containing 250 μmol/L deoxynucleotide triphosphates, 250 nmol/L of each primer, 1× Boehringer Mannheim PCR buffer (10 mmol/L Tris-HCl, 50 mmol/L KCl, and 1.5 mmol/L MgCl2, pH 8.3) and 2.5 U Taq DNA polymerase (Boehringer Mannheim). Oligonucleotide primers used are detailed in Table 1 ▶ . Five pairs of oligonucleotide primers were used to identify transcription of chymase genes commonly expressed in mouse mast cells: mMCP-1, 2, 4, and 5. 14,20,21,22,23,24 All primers were designed to span an intron to ensure that genomic DNA was distinguishable from cDNA PCR products. In addition, oligonucleotide primers for SCF, transcribed by jejunal epithelial cells 25,26 and mouse carboxypeptidase A 27 (Table 1) ▶ , were used in some PCRs (infected jejunum only). Primers for a 514-bp fragment from mouse β-actin cDNA, 5′-TGTGATGGTGGGAATGGGTCAG (5′ primer) and 5′-TTTGATGTCACGCACGATTTCC (purchased from Stratagene, Cambridge, UK), were included in all PCR reactions as a control to eliminate variations in the heparinase/RT reactions that could affect the efficiency of subsequent PCR reactions. The RNA concentrations 1, 0.1, and 0.01 μg RNA/20 μl in the RT reaction (final amounts in PCR of 100, 10, and 1 ng) were determined in initial pilot studies. PCRs for carboxypeptidase A and SCF were carried out at a single RNA concentration of 10 ng/PCR reaction with the sole purpose of detecting the presence or absence of these transcripts. Controls included in the PCR reactions were RNA only (no cDNA) and primers only (no target).
Table 1.
PCR Primers and Product Sizes
| Gene | Primer | Sequence | Product size from cDNA (bp) |
|---|---|---|---|
| mMCP-1* | 5′ | 5′-GGAAAACTGGAGAGAAAGAACCTAC | 460 |
| 3′ | 5′-GACAGCTGGGGACAGAATGGGG | ||
| mMCP-2† | 5′ | 5′-ATTTCATTGCCTAGTTCCTCTGAC | 525 |
| 3′ | 5′-CAGGATGAGAACAGGCTGGGAT | ||
| mMCP-4‡ | 5′ | 5′-GTAATTCCTCTGCCTCGTCCTTC | 454 |
| 3′ | 5′-GGACAGGATGGACACATGCTTT | ||
| mMCP-5§ | 5′ | 5′-GGCAGAACAAACGTGAATGAGCC | 418 |
| 3′ | 5′-AAGAACCTTCTGGAAGCTCAGGG | ||
| Carboxypeptidase A¶ | 5′ | 5′-ACACAGGATCGAATGTGGAG | 689 |
| 3′ | 5′-TAATGCAGGACTTCATGAGC | ||
| SCF∥ | 5′ | 5′-GCCTTTCCTTATGAAGAAGA | 575 |
| 3′ | 5′-TGCAACAGGGGGTAACATAAATGG |
PCR products were separated on 1.2% agarose gels and recorded with a charge-coupled device camera linked to an image processor (Appligene, Warford, UK), and the band intensities were analyzed using a densitometry package (Quantiscan II for Windows 95; Biosoft, Cambridge, UK). The intensity of each band was measured relative to the intensity of its corresponding β-actin signal. The authenticity of the PCR products was confirmed by Southern hybridization using gene-specific oligonucleotide probes, the sequences of which are shown in Table 2 ▶ . One hundred pmol of each oligonucleotide probe was 3′ end-labeled with DIG-dideoxyuridine triphosphate using terminal transferase (Boerhinger Mannheim) according to the manufacturer’s instructions. Membranes were hybridized with DIG-labeled probes at 10 pmol/ml in a total volume of 10 ml of Rapidhyb (Amersham) hybridization buffer/membrane for 3 hours at 40°C. Washing steps at high stringency, antibody incubations, and visualization of bands with 5-bromo-4-chloro-3-indolyl phosphate/nitroblue tetrazolium were carried out as described in the section on LT-PCR screening. All PCR products were of the expected sizes for cDNA, and Southern blotting with gene-specific oligonucleotide probes confirmed their identity. No bands were detected in the RNA-only and no-target controls. Contamination from genomic DNA (indicated by a higher-kb band of 800 to 1000 bp for the proteinase genes) was negligible (<5% of cDNA product in samples containing higher RNA concentrations).
Table 2.
Oligonucleotide Probes for PCR Products
| PCR product | Probe sequence |
|---|---|
| mMCP-1 | 5′-AAGGCAGGCTGCACATAG |
| mMCP-2 | 5′-CTCAGAGGTACCAGATGA |
| mMCP-4 | 5′-CCCAAGGGTTATTAGAAGAGCTC |
| mMCP-5 | 5′-TACAGACAGGCCAGATCA |
| Carboxypeptidase A | 5′-AACTCCACCTGCATTGGCACT |
| SCF | 5′-CAAACTTGGATTATCACTTGCAT |
Oligonucleotide probes were designed using the cDNA sequences indicated in Table 1 ▶ .
Detection of Mast Cells by Histochemistry
Mast cells were detected after staining 4 μm-thick sections from paraffin wax-embedded Carnoy’s fixed tissue overnight in 0.5% toluidine blue (Merck, Poole, UK) and 0.5 mol/L HCl pH 0.5, 1 followed by counterstaining with 1% eosin in 70% ethanol, or by staining paraformaldehyde fixed-tissue sections for esterase in Fast Garnet GBC salt and naphthol AS-D chloroacetate (Sigma). 28 Sections were mounted using Vectashield (Vector Laboratories, Bretton, UK).
Detection of mMCP-1 and Other Chymases by Immunohistochemistry
Immunodetection of mMCP-1 was carried out on paraformaldehyde-fixed tissues using the monoclonal antibody (mAb) RF6.1 as described in detail. 17 Chymases were detected using a broad-specificity polyclonal sheep anti-mMCP-1 antibody (Sh α-mMCP-1), which was affinity purified on mMCP-1 sepharose and conjugated to biotin according to the manufacturer’s instructions (EZ-link Sulfo-NHS-LC-Biotin, Pierce, Rockford, IL). Rat immunoglobulin G1 (10 μg/ml; Serotec) was used as a negative control for mAb RF6.1 and biotinylated sheep immunoglobulin G (Sigma) for Sh αmMCP-1. Detection was with avidin/peroxidase (jejunum) and avidin/alkaline phosphatase (ear pinnae) (Vectastain ABC Kit, Vector Laboratories). Sections were counterstained with hematoxylin.
Enumeration of Mast Cells and Statistical Analysis
Tissue sections stained for mMCP-1 (mAb RF6.1), chymases (Sh αmMCP-1), and esterase were counted at ×250 magnification, whereas toluidine blue-stained sections were counted at ×500. Positively stained mast cells were counted in 50 villus crypt units (VCUs) in jejunal sections, and the results are expressed as IMMCs/VCU. 29 Mast cells in longitudinal sections of ear pinnae were counted in 20 adjacent fields (4.8 mm2 total area). Median cell counts were compared using the nonparametric Mann-Whitney test (Minitab) with significance levels of P < 0.05.
Electron Microscopy
Samples of jejunum (∼1 mm3) were immersed in 2.5% glutaraldehyde (pH 7.4) in sodium cacodylate for 4 to 6 hours at room temperature and processed as described by Friend et al. 3 Samples were taken from two +/+ and two −/− mice on each of days 8 and 10 postinfection. Ultrathin sections were stained with uranyl acetate and lead citrate. For each of the four groups, 17 to 40 mast cells (100 to 200 granules) were photographed, and numbers per cell and sizes of individual granules (maximum diameter in μm) were recorded, as was the presence of intragranular structures such as crystalline bodies. In cases in which granules were of uneven shape, the mean of the two longest diameters was taken. The granule sizes were compared using χ 2 analysis with significance levels of P < 0.05.
Quantification of mMCP-1 by Enzyme-Linked Immunosorbent Assay and Detection of mMCP-1 and Other Chymases by Western Blotting
mMCP-1 concentrations were assayed using the RF6.1 monoclonal-based enzyme-linked immunosorbent assay, 17 and the presence of mMCP-1 and of related chymases was determined by sodium dodecyl sulfate-polyacrylamide gel electrophoresis and Western blotting. 17 Blots were blocked in Tris-buffered saline-Tween 80 and probed with mAb RF 6.1 as described. 17 For detection of chymases, blots were blocked with 4% normal sheep serum/Tris-buffered saline-Tween 80 before probing with biotinylated Sh αmMCP-1 (0.6 μg/ml) for 1 hour. Bands were visualized using an avidin-biotin complex technique (Vectastain ABC kit, Vector) followed by detection with 5-bromo-4-chloro-3-indolyl phosphate/nitroblue tetrazolium.
Results
Production of Chimeric and Germline Mutant Mice
Two positive ES cell clones were separately microinjected into C57BL/6 blastocysts and implanted into C57BL/6 × CBA strain pseudopregnant foster females. Both clones gave rise to chimeric males that were then mated to MF1 females. ES cell-derived progeny identified by coat color were screened by Southern blot analysis and LT-PCR to detect germline transmission of the mMCP-1− allele. Matings from one of the chimeras gave germline transmission of the desired homologous recombination event. When MF-1/129 progeny that were heterozygous for the deleted mMCP-1 allele (mMCP-1 +/−) were intercrossed, they produced the expected ratios (2:1:1) of heterozygous (mMCP-1 +/−), wild-type (mMCP-1+/+), and homozygous (mMCP-1−/−) mutant progeny (Figure 1B) ▶ . These mice developed normally and showed normal fertility.
IMMC Kinetics Are Altered during N. brasiliensis Infection in mMCP-1−/− Mice
Infection Kinetics
Groups of 20 −/− and 20 +/+ mice were infected with 500 N. brasiliensis infective larvae (L3). Worm burdens were examined on day 8 (n = 10) and on day 10 (n = 10) when f.e.cs had declined. Maximum (n = 10) occurred on day 7 when there was a fivefold difference between the two groups (Figure 2) ▶ . This was not statistically significant because of sample variability with zero fecal egg counts in two mMCP-1−/− mice and one mMCP-1+/+ control. Recovery of worms from the infected mice again showed a trend toward greater worm burdens in the −/− mice with an approximately twofold difference on day 8 (Table 3) ▶ . When geometric means (log10(x + 1)) were compared, significantly more worms (P < 0.05, Student’s t-test) were found in −/− mice on day 8. Differences were not significant on day 10 (Table 3) ▶ .
Figure 2.

Fecal egg counts in +/+ and −/− mice infected with N. brasiliensis are shown as geometric means (±SE).
Table 3.
Worm Burden Data in mMCP-1 −/− and +/+ Mice on Days 8 and 10 of Infection with N. brasiliensis
| n | mMCP-1+/+ | mMCP-1−/− | |||
|---|---|---|---|---|---|
| Mean (± SE) | log10(x + 1) ± SE | Mean (± SE) | log10(x + 1) ± SE | ||
| Day 8 | 10 | 40 (17) | 1.06 ± (0.27)(A) | 73 (14) | 1.73 ± (0.15)(B) |
| Day 10 | 10 | 2 (1) | 0.28 ± 0.12 | 19 (11) | 0.62 ± 0.31 |
A versus B significant at P < 0.05 (Student’s two-sample t-test).
Mast Cell Counts
In uninfected control mice, toluidine blue-stained IMMCs were rare, with median values of 0.03 IMMCs/VCU for both mMCP-1−/− (range, 0 to 0.07) and mMCP-1+/+ (range, 0 to 0.04) groups of mice (n = 8 for both groups). The few cells that were detected were intraepithelial in both groups. Eight days after infection, the median values were 10.6 IMMCs/VCU in the −/− mice (n = 10) and 15 IMMCs/VCU in the +/+ group (n = 10; P < 0.05) (Figure 3) ▶ . However, by day 10, there was a 2.5-fold increase in the IMMC population (median, 25.7 IMMCs/VCU; range, 15.2 to 65.3) in −/− mice (n = 10), which was significantly (P < 0.03) more abundant than in +/+ mice (median, 19.1 IMMCs/VCU; range, 7.3 to 44) (n = 10) (Figure 3) ▶ .
Figure 3.

The mean IMMC counts (cells/VCU) in −/− and +/+ mice 8 days (top) and 10 days (bottom) after infection are plotted to show cells containing esterase, mMCP-1, or other chymases in paraformaldehyde-fixed jejunum (as indicated). Toluidine blue (Tol. blue) staining of IMMCs is in Carnoy-fixed jejunum. SEs are indicated by vertical bars. The P values shown above each data set were calculated using the Mann-Whitney test.
IMMCs in −/− and +/+ Mice Are Morphologically Distinct
Light Microscopy
After infection, IMMCs in −/− mice were less strongly stained with toluidine blue than were their counterparts in +/+ MF-1 mice. This appeared to be due to the smaller size and reduced staining intensity of the granules (Figure 4 ▶ , A and B). In uninfected controls, the few toluidine blue-positive IMMCs were weakly stained in both −/− and +/+ mice, and it was not possible to detect obvious morphological differences between the two groups. When 1-μm sections of jejunum from infected −/− and +/+ mice were compared, the granules in −/− IMMCs were uniformly round (Figure 4B ▶ , inset), whereas those in +/+ IMMCs were irregularly shaped (Figure 4A ▶ , inset). Because of the sparcity of IMMCs in uninfected mice, no attempt was made to compare them morphologically, and all of the studies described below are from infected mice. The differences observed by light microscopy were more obvious ultrastructurally.
Figure 4.
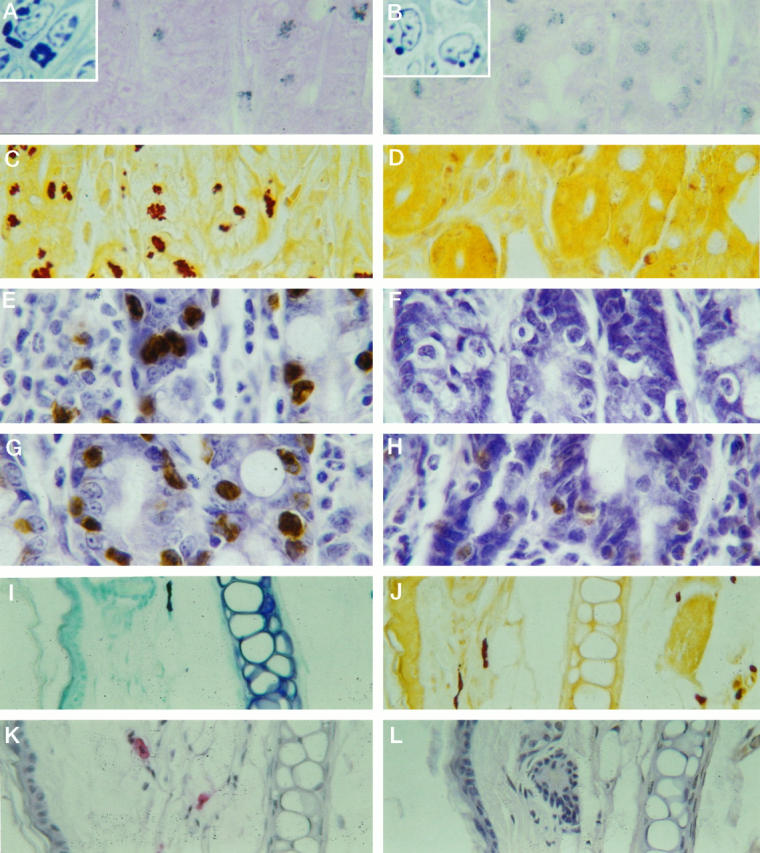
Light micrographs showing staining with toluidine blue (A and B), esterase (C and D), and immunoperoxidase detection for anti-mMCP-1 mAb (mAb RF 6.1) (E and F) and polyclonal sheep anti-mMCP-1 (G and H). All tissues were taken on day 8 of infection. Note the intense staining of +/+ IMMCs (A, C, E, and G) with each of the four techniques and the absence of mAb RF 6.1 detection (F) and the very weak esterase (D) and polyclonal (H) staining of −/− IMMCs. The higher-resolution pictures of individual mast cells in 1-μm sections of plastic-embedded tissues show that the IMMC granules in +/+ jejunum (A, inset) are more irregular in shape and larger than those in the −/− IMMCs (B, inset). The mast cells in ear pinna from −/− mice stain intensely with toluidine blue (I) and are strongly esterase positive (J). Polyclonal antibody labeling of mast cells in ear pinna using an avidin alkaline phosphatase conjugate (K) contrasts with the complete absence of mMCP-1 mAb staining (L). Magnifications: A, B, E, F, G, and H, ×500; C, D, and I to L, ×350; A and B insets, ×1000.
Ultrastructure
Crystalline bodies were abundant in the +/+ IMMCs (Figure 5 ▶ , A and B), being identified in 31 of 36 and 14 of 17 cells on days 8 and 10 of infection, respectively; at least 50% of all of the +/+ granules contained these structures, whereas the majority of the remaining granules were uniformly dense but were irregularly shaped. In contrast, no crystalline structures were observed in any of the −/− granules that were of a more regular, oval shape (Figure 5 ▶ , C, D, and E) in the −/− mice on both days of infection. Approximately 30% of the granules contained unusual intragranular divisions with a dense, unstructured core separated into two or more segments by a lighter stippled matrix (Figure 5 ▶ , C, D, and E). These intragranular divisions were present in 10 of 28 −/− IMMCs on day 8 and in 16 of 47 IMMCs on day 10. Furthermore, −/− IMMCs had significantly smaller granules than +/+ IMMCs (P < 0.0001) according to χ 2 analysis (Figure 6) ▶ , with median diameters of 0.5 and 1.0 μm, respectively, on day 8. The range of granule sizes in both groups on day 10 was more widely dispersed. An apparent shift in granule size from small on day 8 to larger (1–1.6 μm in diameter) in −/− mice on day 10 was obvious. Conversely, a higher proportion of +/+ granules were in the 0.4 to 0.8-μm range on day 10, so they were significantly smaller than in −/− IMMCs (P < 0.0001) (Figure 6) ▶ .
Figure 5.
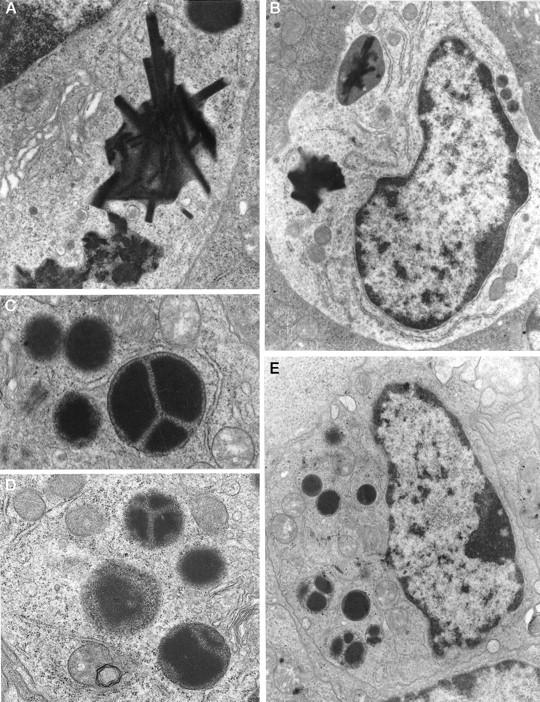
Electron micrographs showing typical IMMCs and IMMC granules from +/+ (A and B) and −/− (C, D, and E) jejunal sections, from day 8 postinfection. The crystalline bodies, clearly visible in electron micrographs (A) and (B), are only found in +/+ IMMCs, whereas granules containing internal divisions (C, D, and E) were exclusive to the −/− IMMCs. Magnifications: B and E, ×14,250; A, C, and D, ×32,000.
Figure 6.
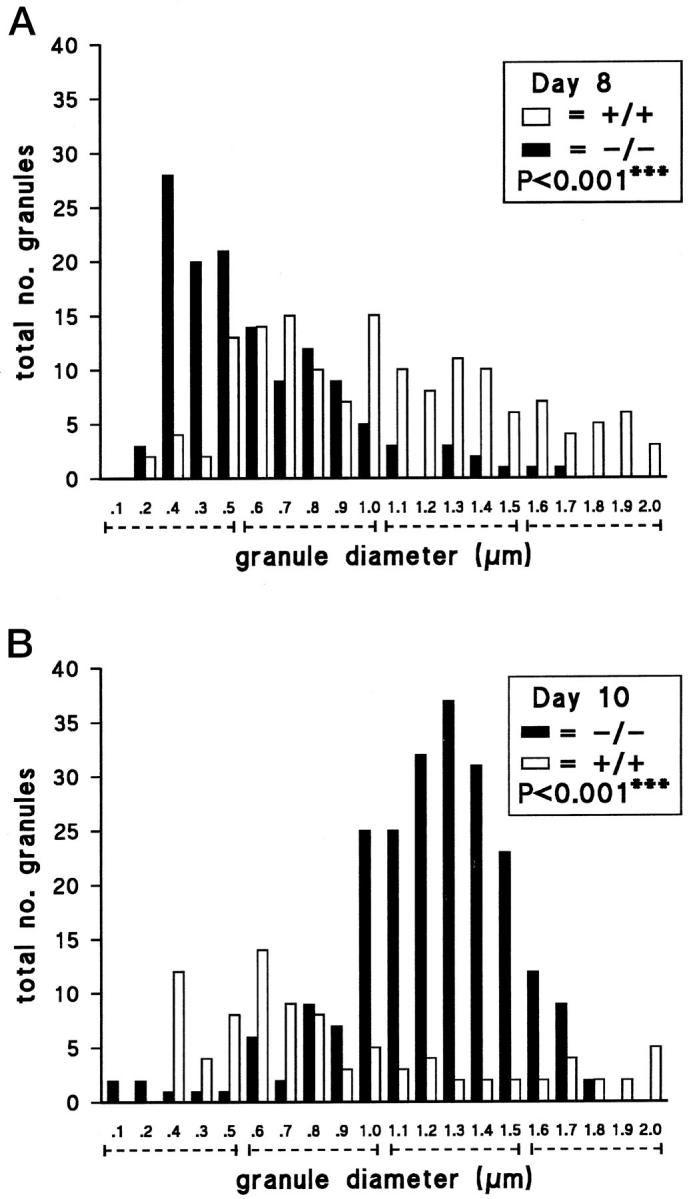
Plots of the frequency distribution of granule diameters (μm) from electron micrographs of +/+ and −/− IMMCs in jejunal sections from days 8 (A) and 10 (B) after N. brasiliensis infection. Granules were classified to the nearest 0.1 μm, up to 2.0 μm (and over). In total, 132 granules (in 28 cells) and 231 granules (in 47 cells) were counted from −/− IMMCs from days 8 and 10 postinfection, respectively. One hundred fifty-two granules (36 cells) and 91 granules (17 cells) were counted from +/+ IMMCs from days 8 and 10. - - - - - , the four size categories pooled for χ 2 analysis; overall P values are indicated.
IMMC Granules in −/− Mice Have Reduced Esterase Activity
A property common to IMMCs and to CTMCs in rodents is that they stain intensely with the esterase substrate naphthol AS-D chloroacetate. 3,28 This is true for IMMCs in normal and in parasitized intestine, 28 and the numbers of cells detected using this substrate when compared with toluidine blue staining 28 or with immunohistochemical detection of β-chymases 17 are highly correlated. Therefore, the intensity of staining for serine esterase was compared in paraformaldehyde-fixed intestines from normal and parasitized +/+ and −/− mice. In uninfected controls, esterase staining was sufficiently strong to detect IMMCs in both groups (n = 8) (median, 0.09 IMMC/VCU in +/+ mice (range, 0.04 to 0.1); median, 0.05 IMMCs/VCU in −/− mice (range, 0.03–0.1)). In contrast, the median values for esterase-stained −/− IMMCs on days 8 and 10 of infection were 1.2 IMMCs/VCU (range, 0.6 to 11.3) and 4.4 IMMCs/VCU (range, 0.3 to 34.6), respectively, against comparable values for toluidine blue staining of 10.6 (P < 0.0025) and 25.7 IMMCs/VCU (P < 0.005) (Figure 3) ▶ . In contrast, the esterase staining and toluidine blue staining in the +/+ controls were not significantly different (Figure 3) ▶ . The IMMCs in all infected +/+ mice were intensely esterase-positive (Figure 4C) ▶ when compared with those in the infected −/− mice (Figure 4D) ▶ , and there were significantly more esterase-positive IMMCs in +/+ mice than in the −/− groups (P < 0.006 on day 8; P < 0.03 on day 10) (Figure 3) ▶ . Overall, therefore, esterase staining was substantially depleted in targeted mice infected with N. brasiliensis.
IMMCs from −/− Mice Lack Mature mMCP-1 Protein
Immunohistochemical analysis of the content of mMCP-1 in paraformaldehyde-fixed normal and parasitized jejunum using a rat monoclonal anti-mMCP-1 antibody (RF 6.1) established that no staining was detectable in −/− groups (Figure 4D) ▶ . Immunostaining was, however, readily detected in all +/+ mice (Figure 4E) ▶ , and cell counts established that the numbers of cells counted for each group were not significantly different from the counts obtained for esterase-positive and toluidine blue-positive IMMCs (Figure 3) ▶ . The same was true for uninfected +/+ and −/− mice, with median values of 0.03 (n = 8) and 0 (n = 8) IMMCs/VCU, respectively. These results clearly show that −/− mice fail to express mature mMCP-1 protein, and that the majority of IMMCs in normal and parasitized +/+ mice contain this enzyme.
The lack of expression of mMCP-1 by IMMCs was further confirmed when homogenates of jejunum were assayed for their content of mMCP-1 by enzyme-linked immunosorbent assay. There was no detectable mMCP-1 in any of the −/− jejunal samples, whereas +/+ mice had jejunal levels of 129.4 ± 18.1 μg/g wet weight of jejunal homogenate on day 8 and 229.2 ± 37.1 μg/g on day 10. The overall increase in mMCP-1 in jejunal homogenates was on the order of 200- to 350-fold in the wild-type +/+ infected mice versus uninfected controls.
Western blots of jejunal homogenates from −/− and +/+ mice, using mAb RF6.1, confirmed the absence of mature mMCP-1 protein in −/− jejunum and the presence of several mMCP-1 glycoforms in +/+ homogenates (Figure 7) ▶ . In contrast, no bands were visualized with mAb RF 6.1 in homogenates of ear pinna (Figure 7) ▶ . When the polyclonal anti-mMCP-1 antibody was used, several intensely stained bands were detected in the 25,000 to 33,000-molecular weight range in homogenates from +/+ jejunum. In jejunal homogenates from infected −/− mice, an intensely stained band of molecular weight approximately 28,000 d was present, as were several higher-molecular weight, less intensely stained bands (Figure 7) ▶ . This result further confirms the absence of mature mMCP-1 protein detectable with mAb RF6.1 in mMCP-1−/− jejunum and demonstrates that the non-cross-absorbed polyclonal anti-mMCP-1 antibody reacts with mMCP-1 and with other putative chymases in infected jejunum from mMCP-1+/+ and mMCP-1−/− mice, respectively. The polyclonal anti-mMCP-1 antibody failed to reveal any specific bands in homogenates of ear pinna (not shown).
Figure 7.

Western blots demonstrating mMCP-1 and other chymases in +/+ and −/− jejunum, respectively, and the absence of mMCP-1 in ear pinna. For control purposes, 120 ng purified mMCP-1 (M1) was run simultaneously. Blotting with sheep polyclonal anti-mMCP-1 (Pab) reveals bands in both −/− and +/+ homogenates. The presence of mMCP-1 in +/+ jejunal homogenate (+/+ jej) and its absence from −/− jejunal homogenate (−/− jej) are confirmed by using mAb RF 6.1 (Mab). The latter antibody fails to detect any signal in homogenates from +/+ (+/+ ear) and −/− (−/− ear) ear pinnae. All homogenates were from day 8 postinfection, and 30 μg of protein was run in each lane.
Immunohistochemical Detection of Other Chymases
Previous studies have shown that the polyclonal antibodies raised against mMCP-1 will, before they are cross-absorbed against rat mast cell protease-1, cross-react with purified mMCP-4 and with several other proteases in CTMCs. 1 In the present study, polyclonal sheep anti-mMCP-1 (Sh α-mMCP-1) detected mast cells in all sites, including isolated peritoneal mast cells (data not shown) and ear pinna (Figure 4K) ▶ , which is in agreement with previous findings. 1 When Sh α-mMCP-1 antibody was used for the immunohistochemical detection of mMCP-1 and other chymases in infected −/− and +/+ jejunum, the intensity of staining and the numbers of positive IMMCs in +/+ jejunum were comparable with those obtained with mAb RF 6.1 (Figures 3 and 4K) ▶ ▶ . Significantly fewer IMMCs were detected with Sh α-mMCP-1 in −/− infected jejunum than in +/+ jejunum (P < 0.01 on days 8 and 10) (Figure 3) ▶ , and the intensity of staining was substantially reduced compared with that of IMMCs in +/+ jejunum (Figure 4 ▶ , G and H). Additionally, there was a tendency for a higher proportion of −/− IMMCs to be chymase positive than to be esterase positive (Figure 3) ▶ . These data are consistent with the RT-PCR results reported below, suggesting that other chymases are present in many of the IMMCs from infected −/− jejunum, but that relative to +/+ IMMCs, levels of expression are low. This would be consistent with the possibility that these residual chymases are in relatively low abundance and/or they lack esterase activity.
Transcription of mMCP-2, -4, and -5 Is Normal in mMCP-1−/− Mice
Oligonucleotide primers specific for the chymase genes mMCP-2, mMCP-4, and mMCP-5 (Table 1) ▶ amplified fragments of the expected size (800 to 900 bp) from +/+ and −/− genomic DNA, the identity of which was confirmed by Southern blotting using gene-specific oligonucleotide probes (data not shown), indicating that these genes had not been disrupted by targeting events. The transcription of these genes was investigated by RT-PCR analysis.
Figure 8 ▶ shows the RT-PCR products from cDNA generated using total RNA samples from uninfected jejunum, jejunum taken 8 days after infection with N. brasiliensis, and ear pinna of mMCP-1+/+ or mMCP-1−/− mice, using primers for mMCP-1, -2, -4 and -5. The transcription of each protease gene was assessed relative to the corresponding β-actin signal for each sample, and results are shown in arbitrary units in Figure 9 ▶ . The mMCP-1 transcript was undetectable in all samples from mMCP-1−/− mice (Figures 8 and 9) ▶ ▶ . In uninfected +/+ jejunum, mMCP-1 transcripts were detected at RNA concentrations of 1 and 0.1 μg/ml but not at 10 ng/ml (Figures 8 and 9) ▶ ▶ . On day 8 of infection, mMCP-1 transcripts were readily detected at all three RNA concentrations in +/+ jejunum. Transcription of mMCP-2 was substantially upregulated in jejunal samples from both mMCP-1+/+ and −/− mice on day 8 of infection when compared with lower levels in uninfected jejunum (Figures 8 and 9) ▶ ▶ . Low or negligible levels of transcription of the chymases mMCP-4 and -5 were detected in jejunum from uninfected mMCP-1+/+ and −/− mice, but, during infection, there was upregulated jejunal transcription of both gene products, although mMCP-4 transcripts appeared to be more abundant (Figures 8 and 9) ▶ ▶ . In the ear pinna, neither mMCP-1 nor mMCP-2 was detectable by RT-PCR, and this contrasted with the abundant mMCP-4 and mMCP-5 transcripts from the same samples (Figures 8 and 9) ▶ ▶ . Transcripts of both SCF and carboxypeptidase A were readily detected in jejunal RNA from infected mMCP-1+/+ and mMCP-1−/− mice, but whereas SCF (expressed in epithelial cells) 26 was also detected in uninfected jejunal samples from mMCP-1+/+ and mMCP-1−/− mice, carboxypeptidase A transcription was negligible (data not shown). In conclusion, therefore, the lack of any detectable mMCP-1 transcripts in the mMCP-1−/− mice and the apparently normal transcription of three other chymases known to be expressed in the gut 3 in these same mice are further evidence that the targeted disruption of the mMCP-1 gene has been highly selective.
Figure 8.

PCR products from RNA samples reverse transcribed and amplified by PCR. Initial dilutions of the RNA template before RT are indicated (1, 0.1, and 0.01 μg/20 μl reaction volumes). Primer sets used for PCR were specific for mMCP-1, mMCP-2, mMCP-4, mMCP-5, and β-actin as indicated. Jejunal samples were from uninfected mMCP-1+/+ and mMCP-1−/− mice (top two panels) , N. brasiliensis-infected mMCP-1+/+ and mMCP-1−/− mice (8 days postinfection) (center two panels), and ear pinna of N. brasiliensis-infected mMCP-1+/+ and mMCP-1−/− mice (bottom two panels).
Figure 9.
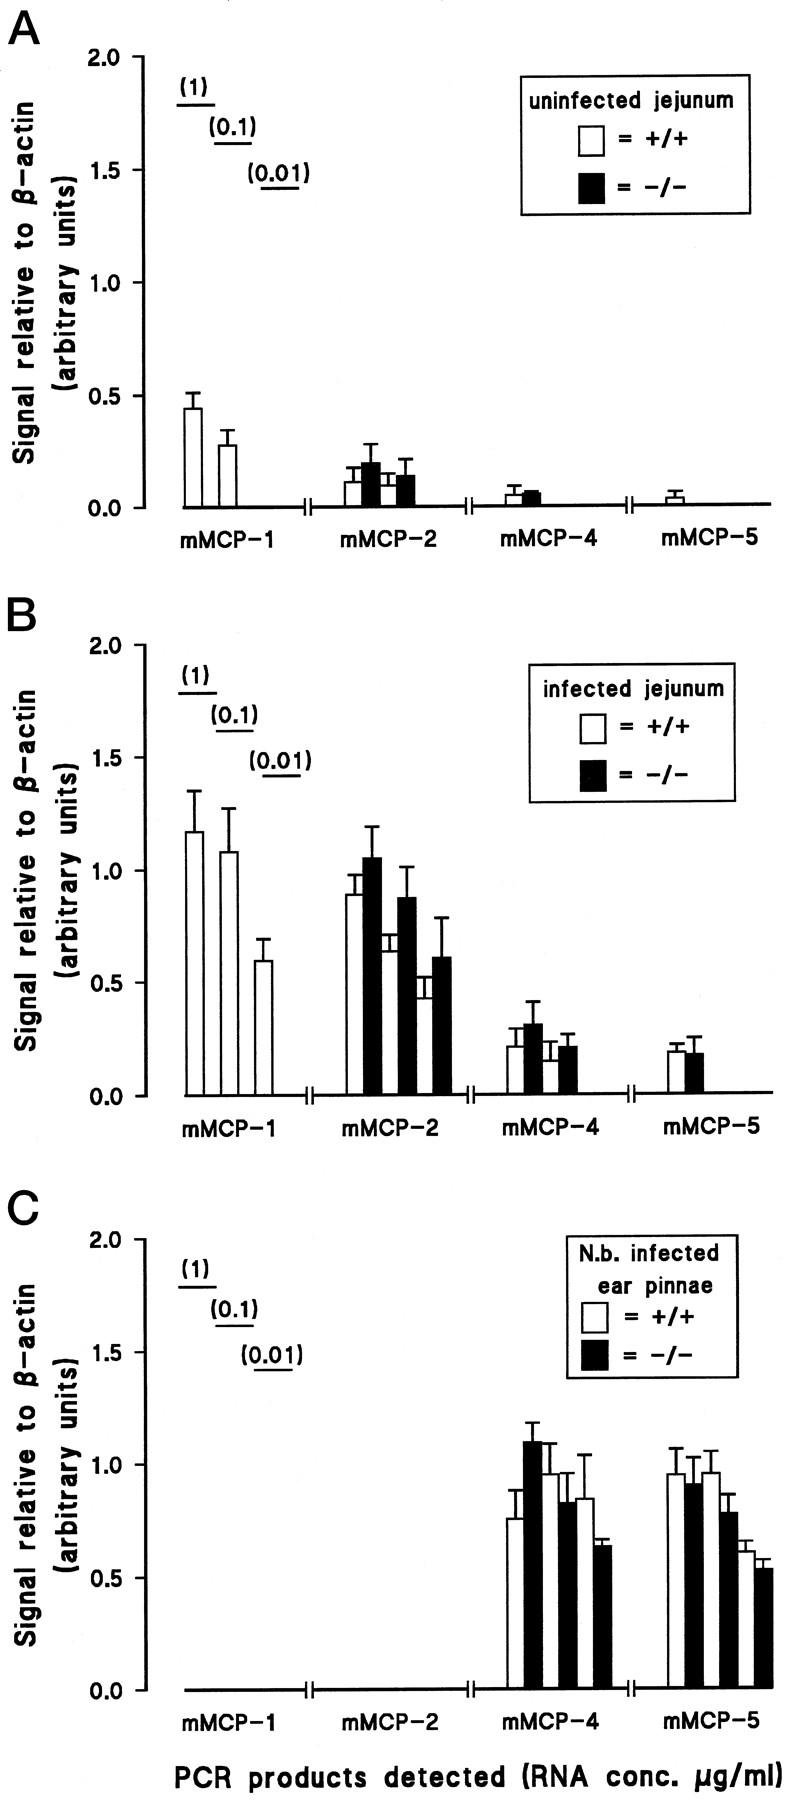
Histograms showing the results of densitometric analysis of protease gene transcription as measured by RT-PCR (see Figure 8 ▶ ). The data show the intensity of each PCR product recorded as a proportion of the corresponding β-actin control PCR product from the same sample, to eliminate variations in the heparinase/RT reactions that could affect the efficiency of subsequent PCR reactions. Graphs are shown to summarize the data from RNA samples from uninfected mMCP-1+/+ and mMCP-1−/− mice (n = 4) (A) and from N. brasiliensis-infected mMCP-1+/+ and mMCP-1−/− mice (n = 5) (B), and ear pinna from N. brasiliensis-infected mMCP-1+/+ and mMCP-1−/− mice (n = 4) (C). Initial dilutions of the RNA template before RT are indicated (1, 0.1, and 0.01 μg/20 μl reaction volume).
CTMCs in −/− Mice Are Phenotypically Normal
In addition to the transcriptional data shown in Figures 8 and 9 ▶ ▶ that suggest that mMCP-4 and -5 are normally present and that mMCP-1 is not transcribed in the ear pinna, many CTMCs in the ear pinna were stained with Sh α-mMCP-1 but not with mAb RF 6.1 (Figure 4 ▶ , K and L). Cell counts after staining the sections with toluidine blue (Figure 4I) ▶ revealed 61.2 ± 5.8 and 69.4 ± 6.4 CTMCs/mm2, and, using esterase staining, the cells were intensely stained (Figure 4J) ▶ and the counts were 59.2 ± 6.2 and 75.1 ± 7.9 CTMCs/mm2 in the ear pinnae from +/+ (n = 9) and −/− mice (n = 10), respectively, on day 8 of infection. The cells had typical mast cell morphology (Figure 4) ▶ , and there were no obvious differences in granule staining intensity between +/+ and −/− CTMCs. Peritoneal cells were harvested from uninfected +/+ (n = 5) and −/− mice (n = 5), and yields were 5.4 ± 0.6 × 10⁶ and 5.1 ± 0.9 × 10⁶ cells, respectively. The percentage mast cell counts were comparable (1.5 ± 0.2% versus 1.5 ± 0.4%) in Leishman’s-stained and in esterase-stained cytospins (1.1 ± 0.1% versus 1.2 ± 0.3%). Again there was no difference in the intensity of esterase staining, which was as strong as that observed in the ear pinna. These data show that targeting the mMCP-1 gene has no obvious effect on mast cells in the connective tissues and serosae.
Discussion
The aim of this study was to characterize the IMMCs in mice lacking the β-chymase mMCP-1. The abundance of IMMCs in nematode-infected intestine 1-3 and the associated accumulation and secretion of the highly soluble β-chymases in rodents 4,12,17 are strongly indicative of a major function for these proteases. It is clear from this study that there are structural differences in the granule matrices of IMMCs in null mice, and that there are substantial histochemical and immunohistochemical differences from their +/+ counterparts. There are also significant kinetic differences in the accumulation of IMMCs with fewer IMMCs on day 8 and more on day 10 of infection in −/− when compared with +/+ jejunum.
The targeting of the mMCP-1 gene was shown to be specific by genomic analysis, and this was further confirmed by the absence of mMCP-1 transcripts in both uninfected and parasitized mMCP-1−/− mice. These genetic data were strongly supported by the immunohistochemistry and immunoassay of mature mMCP-1 protein, which was completely undetectable in −/− jejunal tissue. In conclusion, the genetic and tissue analyses provide convincing evidence that the mMCP-1 gene has been specifically targeted.
Because the mMCP-1 gene is located within a cluster of mast cell- and T-cell-specific protease genes on chromosome 14, 30 we confirmed that transcription of mMCP-2 and -5, in the 850-kb gene cluster, and of mMCP-4, which is also on chromosome 14, 30 was unaffected by the targeting events. For example, mMCP-2 was transcribed at low levels in the uninfected intestine, with transcripts appearing more abundant in parasitized gut. The levels of expression of mMCP-2 in −/− mice was comparable with the levels seen in the +/+ mice. It was clear that CTMCs in the ear pinnae of −/− and +/+ mice expressed mMCP-4 and -5, but not mMCP-1 or -2. This pattern is consistent with that seen in BALB/c mice, in which transcription of mMCP-2 and the presence of mature mMCP-2 protein has been described in the gut but not in CTMCs. 31 Some other strains of mice, including the WBB6 F1/J, express mMCP-2 in some CTMCs, 31 but mMCP-1 appears not to be expressed in any tissues other than those associated with mucosal surfaces, 17 and in almost every report the mMCP-1-positive mast cells were predominantly intraepithelial. 1,3,17 The levels of expression of mMCP-4 and -5 in normal and parasitized gut appeared to be lower than that of mMCP-2 but were apparently unaffected by the disruption of the mMCP-1 gene. These semiquantitative analyses of gene transcription indicate that the other major chymases in IMMCs and CTMCs are expressed normally in the mutant mice and further confirm the specificity of the targeting event.
Light microscopy suggested that IMMCs in −/− mice had smaller, less intensely toluidine blue-positive granules that often did not stain for esterase and were poorly immunostained by polyclonal anti-mMCP-1 and not at all with mAb RF 6.1. Ultrastructural analysis established that the classical paracrystalline structures, described in IMMCs from mice 2,3 and rats 32 and clearly present in +/+ IMMCs, were completely absent from −/− IMMCs. Instead, new structural features in the granule matrices and a more rounded as opposed to a stellate appearance of the granules predominated. The fact that the granules remained toluidine blue positive suggested that proteoglycans were still present. Importantly, the polyclonal antibody detected proteins within the IMMCs consistent with the molecular weights of mMCP-2, -4 and -5. 20,33,34 It is not clear whether this polyclonal antibody, which was affinity purified on mMCP-1-sepharose, reacts with mMCP-2, but because it binds to CTMCs, which, in this strain of mice, do not express mMCP-1 or -2, 31 it probably cross-reacts with mMCP-4 or -5. However, the transcription studies suggest that neither of the latter proteases are abundantly expressed in the jejunum, and this is substantiated by the histochemical data showing low levels of chloroacetate staining in −/− IMMCs.
The only previous quantitative analysis of IMMC granule ultrastructure in parasitized mice is consistent with our observation that every intraepithelial IMMC contained granules that were stellate or irregularly shaped because of the presence of crystals. 3 In parasitized rats, paracrystalline structures were identified in IMMCs at a time during infection when there was histochemical evidence of depletion of proteoglycan and monoamines from the granules. 32,35 In both rat and mouse, the concept that IMMCs were activated and releasing granule products was confirmed by showing that the release of rMCP-II and of mMCP-1 both systemically and into the gut lumen was maximal 6 to 10 days after infection, a time when peak numbers of IMMCs were both intraepithelial and their granules contained crystals. 32,35,36 It is tempting to suggest that both of these chymases are sufficiently concentrated in the granules to form crystals, and that crystal formation could be facilitated by the loss of other granule matrix constituents such as chondroitin sulfate. We have shown previously, for example, that the release of glycosaminoglycans into rat plasma is significantly correlated with levels of rMCP-II during systemic anaphylactic shock, 37 and the diminishing levels of chloroacetate and proteoglycan staining in rat IMMCs in the jejunum were also highly correlated, 37 indicating that IMMCs were being substantially depleted. This suggests that both proteoglycan and protease diffuse rapidly out of, and away from, the cell, unlike heparin/rMCP-I or heparin/tryptase complexes. 38,39 Three-dimensional modeling of mMCP-1, -2, -4, and -5 suggests that mMCP-1 and -2 lack one of the two clusters of basic residues present on mMCP-4 and -5 and that the remaining cluster has a relatively low charge density. 38 The two regions predicted to have a strong electrostatic potential on mMCP-4 and -5 are thought to contribute to the binding of these highly cationic proteases to heparin 38 in CTMCs. Because IMMCs lack heparin, 4,6,36 the high concentrations of β-chymases (∼100 to 150 pg rMCP-II/cell), 36 may be sufficient, when conditions are right, for crystals to form. It is reasonable to hypothesize, therefore, that the absence of crystals in −/− IMMCs is the direct consequence of the absence of mMCP-1.
Given that, apart from mMCP-1, protease expression in IMMCs was likely to be normal, one of the most surprising differences between targeted and control mice was the substantial diminution of esterase activity in the −/− IMMCs. This was most obvious in parasitized mice in which mast cells were so abundant that there was no difficulty in recognizing these very striking histochemical differences. However, there was very intense esterase staining of CTMCs and of serosal mast cell granules that do not express mMCP-1, and although the lack of mMCP-1 in the −/− IMMCs may account for the diminished esterase staining in the gut, it is also possible that mMCP-2 contributes little to the esterase activity and that the concentrations of mMCP-4 and -5 are too low to generate strong esterase activity. An alternative possibility, given the structural differences in the granules, is that the stacking of the proteases on the glycosaminoglycan side chains 38 is disrupted and that the proteases are either nonfunctional or are catabolized in the granules. The most likely explanation, however, given the rather weak immunostaining of IMMCs with polyclonal Sh α-mMCP-1 is that, apart from mMCP-1, the chymases in IMMC granules are in low abundance.
The time frame of this study, focusing on the early mast cell response rather than the resolution of the response several weeks later, does not allow us to distinguish the different mast cell phenotypes described by Friend et al, 3 and it would be interesting to determine whether, during this phase of resolution, the −/− IMMC phenotypes vary in the same way as their +/+ counterparts. Transcripts of mMC-CPA were detected in jejunal RNA from −/− and +/+ mice, which correlates with recent observations that IMMCs in parasitized mice express mMC-CPA, 27 although no attempts were made to quantify these transcripts in this study, nor were appropriate antibodies available to determine whether the mature protein was equally abundant in −/− and +/+ groups of mice.
The differences in IMMC kinetics in −/− and +/+ jejunum are potentially of greatest interest but must be interpreted with considerable caution at this stage, because all of the +/+ controls were random-bred wild-type MF-1, which, although matched for age and sex, were genetically distinct from the −/− MF-1/S-129-null mice. However, we obtained similar results in a pilot experiment carried out using mMCP-1+/+ and −/− littermates from a heterozygote cross. On day 10 of N. brasiliensis infection, esterase-positive IMMCs were less abundant and less intensely stained in the −/− mice compared with their +/+ littermates. Most studies in mast cell-deficient mice suggest that IMMCs have relatively little influence on the immunological expulsion of N. brasiliensis, and the findings reported here show relatively minor (twofold) differences in worm burdens between the two groups on day 8 of infection. The question may be resolved more readily in current studies with −/− and +/+ littermates infected with Strongyloides ratti or Trichinella spiralis, in which there is stronger evidence of IMMC involvement in the immunological rejection of both parasites. 11,40,41
Although the differences in cell kinetics could be due to the variable levels of infection and to background gene differences, the absence of mMCP-1 could directly affect the turnover of IMMCs. For example, it has been shown in sheep that IMMCs escape onto the mucosal surface, 42 and although it is probable that intraepithelial mast cells will, like mature enterocytes, be shed as they migrate up the villus column, they could also escape through the tight junctions if, as our previous studies with rMCP-II using ex vivo perfusion suggest, 12 β-chymases permeabilize enterocyte tight junctions. One of our long-term aims in deleting mMCP-1 is to test in vivo the hypothesis that β-chymases contribute to the immunological expulsion of nematodes by promoting the pathotopic transfer of immunoglobulins from the mucosa into the lumen of the gut. The present results, showing that there is robust IMMC recruitment in the absence of mMCP-1, suggest that it will be feasible to determine the contribution of these abundant proteases to the intestinal pathology associated with nematode infection.
Acknowledgments
Both the first and second authors contributed equally to this work.
We thank Dr. Colin McInnes for his helpful advice; Jean Vaagenes for technical assistance; Louise Anderson, Andrew Jeske, Eileen Duncan, and Liz Moore for technical assistance with and maintenance of the transgenic mice; and Bob Munro for the photography in this paper. We are indebted to Steve Mitchell for assistance and technical help with the ultrastructural studies.
Footnotes
Address reprint requests to H. R. P. Miller, Department of Veterinary Clinical Studies, Royal (Dick) School of Veterinary Studies, Easter Bush Veterinary Centre, Roslin, Midlothian EH25 9RG, UK. E-mail: hugh.miller@ed.ac.uk.
Supported by grants 036079/Z/92/A/JRS/SH and 050065 from the Wellcome Trust.
Jonathan M. Wastling’s present address is Division of Infection and Immunity, Institute of Biomedical Life Sciences, Joseph Black Building, University of Glasgow, Glasgow G12 8QQ, UK.
Cheryl L. Scudamore’s present address is Dept. of Veterinary Pathology, Royal (Dick) School of Veterinary Studies, Easter Bush Veterinary Centre, Roslin, Midlothian EH25 9RG, UK.
References
- 1.Miller HRP, Huntley JF, Newlands GFJ, Mackellar A, Lammas D, Wakelin D: Granule proteinases define mast cell heterogeneity in the serosa and the gastrointestinal mucosa of the mouse. Immunology 1988, 65:559-566 [PMC free article] [PubMed] [Google Scholar]
- 2.Crowle PK, Phillips DE: Characteristics of mast cells in Chediak-Higashi mice: light and electron microscopic studies of connective tissue and mucosal mast cells. Exp Cell Biol 1983, 51:130-139 [DOI] [PubMed] [Google Scholar]
- 3.Friend DS, Ghildyal N, Austen KF, Gurish MF, Matsumoto R, Stevens RL: Mast cells that reside at different locations in the jejunum of mice infected with Trichinella spiralis exhibit sequential changes in their granule ultrastructure and chymase phenotype. J Cell Biol 1996, 135:279-190 [DOI] [PMC free article] [PubMed] [Google Scholar]
- 4.Miller HRP: Mucosal mast cells and the allergic response against nematode parasites. Vet Immunol Immunopathol 1996, 54:331-336 [DOI] [PubMed] [Google Scholar]
- 5.Irani A-MA, Bradford TR, Kepley CL, Schechter NM, Schwartz LB: Deficiency of the tryptase-positive chymase-negative mast cell type in the gastrointestinal mucosa of patients with defective lymphocyte function. J Immunol 1987, 138:4381-4386 [PubMed] [Google Scholar]
- 6.Enerback L: Mucosal mast cells in the rat and man. Int Arch Allergy Appl Immunol 1987, 82:249-253 [DOI] [PubMed] [Google Scholar]
- 7.Rothwell TLW: Immune expulsion of parasite nematodes from the alimentary tract. Int J Parasitol 1989, 19:139-168 [DOI] [PubMed] [Google Scholar]
- 8.Morii Y, Nawa Y: Heparin containing mast cells in the jejunal mucosa of normal and parasitised Mongolian gerbils, Meriones unguiculatus. Int Arch Allergy Appl Immunol 1992, 98:415-419 [DOI] [PubMed] [Google Scholar]
- 9.Gutowska L, Ruitenburg EJ, Elgersma A, Kociecka W: Increase of mucosal mast cells in the jejunum of patients infected with Trichinella spiralis. Int Arch Allergy Appl Immunol 1983, 71:304-308 [DOI] [PubMed] [Google Scholar]
- 10.Newlands GFJ, Miller HRP, Mackellar A, Galli SJ: Stem cell factor contributes to intestinal mucosal mast cell hyperplasia with Nippostrongylus brasiliensis or Trichinella spiralis, but anti-stem cell factor treatment decreases parasite egg production during N. brasiliensis infection. Blood 1995, 86:1968-1976 [PubMed] [Google Scholar]
- 11.Donaldson LE, Schmitt E, Huntley JF, Newlands GFJ, Grencis RK: A critical role for stem cell factor and c-kit in host protective immunity to an intestinal helminth. Int Immunol 1996, 8:559-567 [DOI] [PubMed] [Google Scholar]
- 12.Scudamore CL, Thornton EM, McMillan L, Newlands GFJ, Miller HRP: Release of the mucosal mast cell granule chymase, rat mast cell protease-II, during anaphylaxis is associated with the rapid development of paracellular permeability to macromolecules in rat jejunum. J Exp Med 1995, 182:1871-1881 [DOI] [PMC free article] [PubMed] [Google Scholar]
- 13.Bohm SK, Khitin LM, Grady EF, Aponte G, Payan DG, Bunnett NW: Mechanisms of desensitization and resensitization of protease-activated receptor 2. J Biol Chem 1996, 271:22003-22016 [DOI] [PubMed] [Google Scholar]
- 14.Huang R, Blom T, Hellman L: Cloning and structural analysis of mMCP-1, mMCP-4 and mMCP-5, three mouse mast cell-specific proteases. Eur J Immunol 1991, 21:1611-1621 [DOI] [PubMed] [Google Scholar]
- 15.Joyner AL, Skarnes WC, Rossant J: Production of a mutation in mouse En-2 gene by homologous recombination in embryonic stem cells. Nature 1989, 338:153-156 [DOI] [PubMed] [Google Scholar]
- 16.Sambrook J, Fritsch EF, Maniatis T: Molecular Cloning: A Laboratory Manual, ed 2 1989, Cold Spring Harbor Laboratory Press, Cold Spring Harbor, NY,
- 17.Scudamore CL, McMillan L, Thornton EM, Wright SH, Newlands GFJ, Miller HRP: Mast cell heterogeneity in the gastrointestinal tract: variable expression of mouse mast cell protease-1 (mMCP-1) in intraepithelial mucosal mast cells in nematode infected and normal BALB/c mice. Am J Pathol 1997, 150:1661-1672 [PMC free article] [PubMed] [Google Scholar]
- 18.Wastling JM, Scudamore CL, Thornton EM, Newlands GFJ, Miller HRP: Constitutive expression of mouse mast cell protease-1 in normal BALB/c mice and its up-regulation during intestinal nematode infection. Immunology 1997, 90:308-313 [DOI] [PMC free article] [PubMed] [Google Scholar]
- 19.Tsai M, Miyamoto M, Tam S-Y, Wang Z-s, Galli SJ: Detection of mouse mast cell-associated protease mRNA: heparinase treatment greatly improves RT-PCR of tissues containing mast cell heparin. Am J Pathol 1995, 146:335-343 [PMC free article] [PubMed] [Google Scholar]
- 20.Ghildyal N, McNeil HP, Stechschulte S, Austen KF, Silberstein D, Gurish MF, Somerville LL, Stevens RL: IL-10 induces transcription of the gene for mouse mast cell protease-1, a serine protease preferentially expressed in mucosal mast cells of Trichinella spiralis-infected mice. J Immunol 1992, 149:2123-2129 [PubMed] [Google Scholar]
- 21.Serafin WE, Reynolds DS, Rogelj S, Lane WS, Conder GA, Johnson SS, Austen F, Stevens RL: Identification and molecular cloning of a novel mouse mucosal mast cell serine protease. J Biol Chem 1990, 265:423-429 [PubMed] [Google Scholar]
- 22.Serafin WE, Sullivan TP, Conder GA, Ebrahimi A, Marcham P, Johnson SS, Austen KF, Reynolds RS: Cloning of the cDNA and the gene for mouse mast cell protease-4. J Biol Chem 1991, 266:1934-1941 [PubMed] [Google Scholar]
- 23.McNeil HP, Austen KF, Somerville LL, Gurish MF, Stevens RL: Molecular cloning of the mouse mast cell protease-5 gene. J Biol Chem 1991, 266:20316-20322 [PubMed] [Google Scholar]
- 24.Zaheer A, Zhong W, Lim R: Expression of mRNAs of multiple growth factors and receptors by neuronal cell lines: detection with RT-PCR. Neurochem Res 1995, 20:1457-1463 [DOI] [PubMed] [Google Scholar]
- 25.Anderson DM, Lyman A, Baird JM, Wignall J, Eisenman C, Rauch CJ, March HS, Boswell SD, Gimpel D, Cosman D, Williams DE: Molecular cloning of mast cell growth factor, a hematopoietin that is active in both membrane bound and soluble forms. Cell 1990, 63:235-243 [DOI] [PubMed] [Google Scholar]
- 26.Klimpel GR, Chopra AK, Langley KE, Wypych J, Annable CA, Kaiserlian D, Ernst PB, Peterson JW: A role for stem cell factor and c-kit in the murine intestinal tract secretory response to cholera toxin. J Exp Med 1995, 182:1931-1942 [DOI] [PMC free article] [PubMed] [Google Scholar]
- 27.Jippo T, Tsujino K, Kim H, Kim D, Lee Y, Nawa Y, Kitamura Y: Expression of mast-cell specific proteases in tissues of mice studied by in situ hybridization. Am J Pathol 1997, 150:1373-1382 [PMC free article] [PubMed] [Google Scholar]
- 28.Huntley JF, Newlands GFJ, Gibson S, Ferguson A, Miller HRP: Histological demonstration of chymotrysin-like serine esterases in mucosal mast cells in four species including man. J Clin Pathol 1985, 38:375-384 [DOI] [PMC free article] [PubMed] [Google Scholar]
- 29.Miller HRP, Jarrett WFH: Intestinal mast cell responses during helminth expulsion in the rat. Immunology 1971, 20:227-288 [PMC free article] [PubMed] [Google Scholar]
- 30.Gurish MF, Nadeau JH, Johnson KR, McNeil HP, Grattan KM, Austen KF, Stevens RL: A closely linked complex of mouse mast cell-specific chymase genes on chromosome 14. J Biol Chem 1993, 268:11372-11379 [PubMed] [Google Scholar]
- 31.Stevens RL, Friend DS, McNeil HP, Schiller V, Ghildyal N, Austen KF: Strain-specific and tissue-specific expression of mouse mast cell secretory granule proteases. Proc Natl Acad Sci USA 1994, 91:128-132 [DOI] [PMC free article] [PubMed] [Google Scholar]
- 32.Miller HRP: Immune reactions in mucous membranes. III. The discharge of intestinal mast cells during helminth expulsion in the rat. Lab Invest 1971, 24:348-354 [PubMed] [Google Scholar]
- 33.McNeil HP, Frenkel DP, Austen KF, Friend DS, Stevens RL: Translation and granule localization of mouse mast cell protease 5: immunodetection with specific anti-peptide Ig. J Immunol 1992, 149:2466-2472 [PubMed] [Google Scholar]
- 34.Newlands GFJ, Knox DP, Pirie-Shepherd SR, Miller HRP: Biochemical and immunological characterisation of multiple glycoforms of mouse mast cell protease-1: comparison with an isolated murine serosal mast cell protease (MMCP-4). Biochem J 1993, 294:127-135 [DOI] [PMC free article] [PubMed] [Google Scholar]
- 35.Miller HRP, Walshaw R: Immune reactions in mucous membranes. IV. Histochemistry of intestinal mast cells during helminth expulsion in the rat. Am J Pathol 1972, 69:195-208 [PMC free article] [PubMed] [Google Scholar]
- 36.Miller HRP, Huntley JF, Newlands GFJ, Irvine J: Granule chymases and the characterisation of mast cell phenotype and function in rat and mouse. Monogr Allergy 1990, 27:1-30 [PubMed] [Google Scholar]
- 37.King SJ, Reilly K, Dawes J, Miller HRP: The presence in blood of both glycosaminoglycan and mucosal mast cell protease following systematic anaphylaxis in the rat. Int Arch Allergy Appl Immunol 1985, 76:286-291 [DOI] [PubMed] [Google Scholar]
- 38.Sali A, Matsumoto R, McNeil P, Karplus M, Stevens RL: Three-dimensional models of four mouse mast cell chymases: identification of proteoglycan binding regions and protease-specific antigenic epitopes. J Biol Chem 1993, 268:9023-9034 [PubMed] [Google Scholar]
- 39.Pejler G, Maccarana M: Interaction of heparin with rat mast cell proteinase 1. J Biol Chem 1994, 269:14451-14456 [PubMed] [Google Scholar]
- 40.Ha TY, Reed ND, Crowle PK: Delayed expulsion of adult Trichinella spiralis by mast cell deficient W/Wv mice. Infect Immun 1983, 41:445-447 [DOI] [PMC free article] [PubMed] [Google Scholar]
- 41.Abe T, Nawa Y: Localisation of mucosal mast cells in W/Wv mice after reconstitution with bone marrow cells or cultured mast cells, and its relation to the protective capacity to Strongyloides ratti infection. Parasite Immunol 1987, 9:477-485 [DOI] [PubMed] [Google Scholar]
- 42.Stankiewicz M, Pernathaner W, Cabaj W, Jonas WE, Douch PGC, Bisset SA, Rabel B, Pfeffer A, Green RS: Immunisation of sheep against parasitic nematodes leads to elevated levels of globule leukocytes in the small intestine lumen. Int J Parasitol 1995, 25:389-394 [DOI] [PubMed] [Google Scholar]