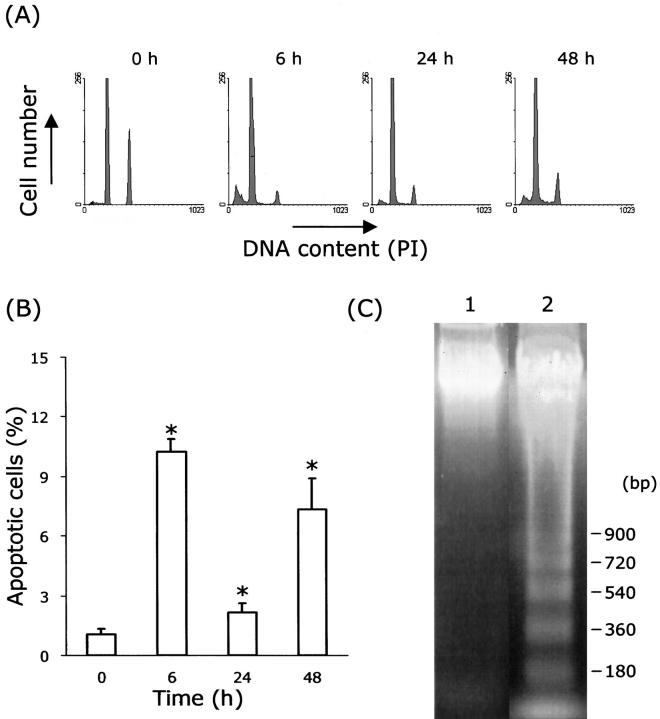
Figure 6.
Flow cytometry and DNA gel electrophoresis of hepatocytes from CCl4-treated rat liver. A: Histograms of DNA content at various time points after the CCl4 treatment. Each peak (6 h, 24 h, 48 h) shows an accumulation of sub-G0/G1, G0/G1, and G2/M, respectively. B: Percentage of apoptotic cells is obtained from analysis of flow cytometry. Values are means ± SD. *P < 0.05 compared with 0 hours. C: DNA fragmentation image. Lane 1, 0 hours; Lane 2, 6 hours after injection of CCl4. PI, propidium iodide.

