
Figure 3.
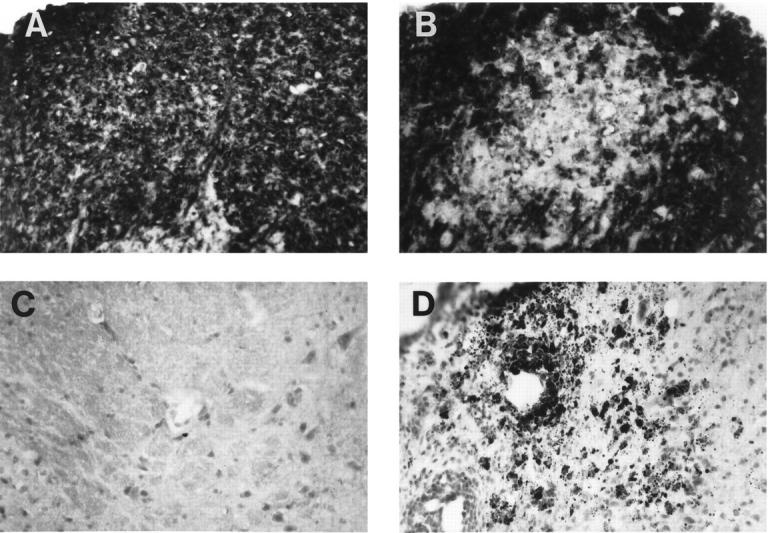
Active demyelination in the spinal cord. A and B: CNPase immunohistochemical stain on control (A) and GT-2 (B) spinal cord sections. Original magnification, ×312. C and D: Oil red O stain and immunohistochemistry was performed as described in Materials and Methods. Oil red O stain of neutral fat in wild-type control (C) and GT-2 (D) spinal cord. Original magnification, ×312.