
Figure 1.
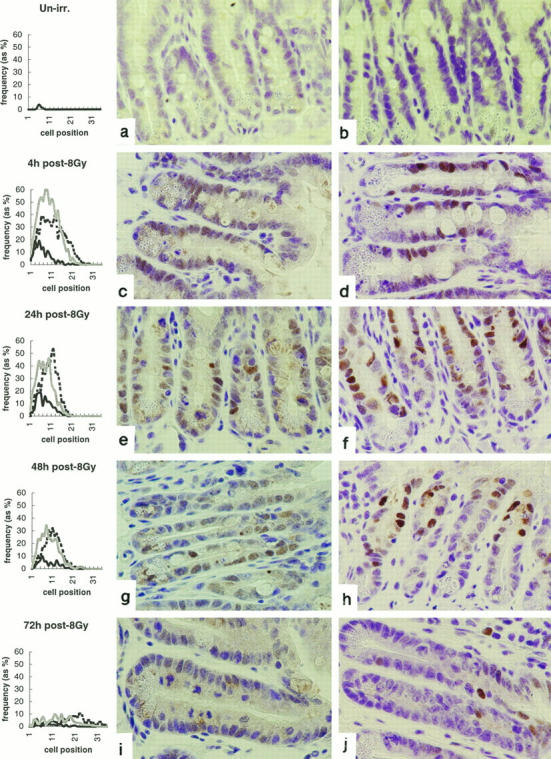
Radiation-induced apoptosis and expression of p53 and p21WAF-1/CIP1 in murine small intestinal epithelium. Line graphs show distributions of apoptotic (bold, solid line), p53-positive (shaded line), and p21WAF-1/CIP1-positive (dashed line) cells in small intestinal crypts at indicated times after exposure to 8 Gy γ-radiation. Cells are scored on a positional basis, as previously described (Ijiri and Potten 1983). 31 a, c, e, g, and i illustrate p53 immunoreactivity; b, d, f, h, and j show P21WAF-1/CIP1 immunoreactivity. Data are mean results from a minimum of three mice at each time point. At least 1000 cells (50 half-crypts) were scored from each mouse. The data are from one representative experiment typical of three.