
Figure 3.
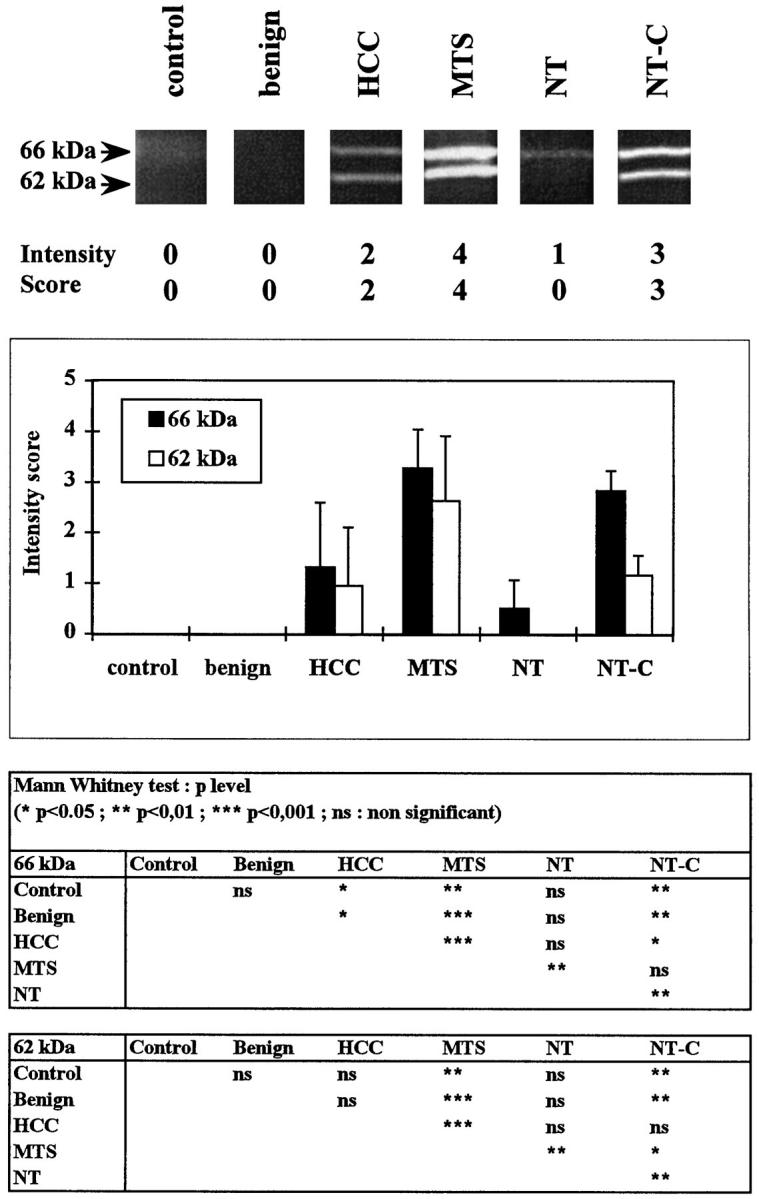
Zymography analyses. Sections (5 μm/1 cm2) from 53 biopsy samples (control livers, benign tumors, HCCs, hepatic metastases from colonic adenocarcinomas (MTS), and nontumorous samples from livers with metastases with either minimal histopathological changes (NT) or cholestasis (NT-C) were homogenized in sample buffer and electrophoresed on an SDS-7% polyacrylamide gel copolymerized with 1 mg/ml gelatin. Five intensity levels based on densitometric analyses were determined for the Mr 66 and Mr 62 kd bands. Top: Representative zymogram with densitometric range. Middle: Semiquantitative analyses of gelatinolytic activity. Bottom: Results are expressed as means ± SD. The Mann-Whitney U test was used to test the significance of the differences between means.