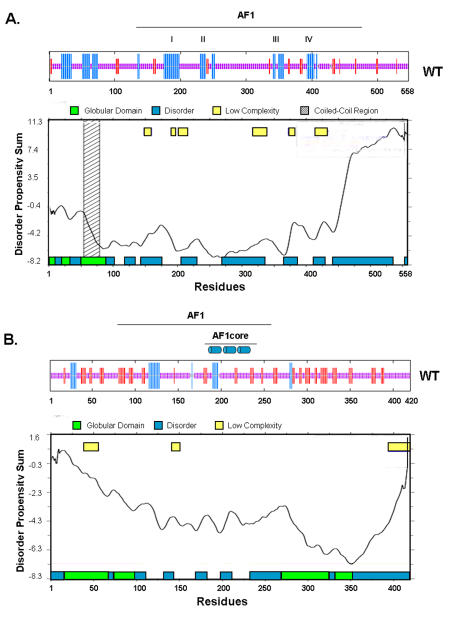
Figure 2. Consensus secondary structure and disorder predictions for AR-NTD and GR-NTD.
(A) and (B) Consensus secondary structure [Combet et al., 2000] and disorder predictions (Glob plot: Linding et al., 2003) for the AR-NTD and GR-NTD, respectively. The location of AF1 is shown above the secondary structure plot (blue and red bars represent α-helix and β-strand structure, respectively) for AR and GR. In addition the four putative helical regions in AR-AF1 are indicated (A, I-IV) and the location of three helices observed in the GR-AF1 core (B) are highlighted.

