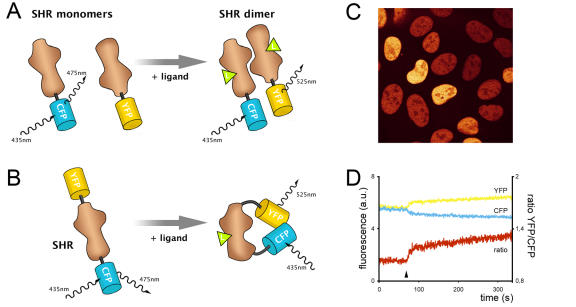
Figure 3. Fluorescence resonance energy transfer (FRET).
A. Principle of FRET to measure intermolecular interaction. Exciting the blue variant of GFP (CFP) linked to one Steroid Hormone Receptor (SHR) monomer at 435nm results in emission at 475nm, unless energy is transferred to a SHR monomer coupled to the yellow variant of GFP (YFP). This phenomenon only occurs when both monomers physically interact as a dimer, and results in increased YFP emission at 525nm at the cost of CFP emission at 475nm. B. A similar protocol is followed to measure intramolecular FRET. A single SHR monomer is tagged with two variants of GFP. Ligand binding induces conformational changes within the receptor and alters the relative orientation and distance between the two fluorophores, leading to changes in FRET efficiency. C. A confocal microscopy image showing U2OS cells expressing nuclear YFP-ER-CFP to monitor conformational changes through intramolecular FRET. Fluorescence is depicted in false colors. D. An example FRET trace, measuring intramolecular FRET between CFP and YFP within a single nucleus of a YFP-ER-CFP expressing cell as shown in 3C. The fluorescent signal of YFP (yellow) and CFP (cyan) is arbitrarily set to the same level such that the ratio (red) is 1, and followed in time. After 80 seconds, tamoxifen is added to the cells (arrowhead) and a conformational change is observed in the form of a change in FRET; the YFP signal increases at the cost of CFP fluorescence.

