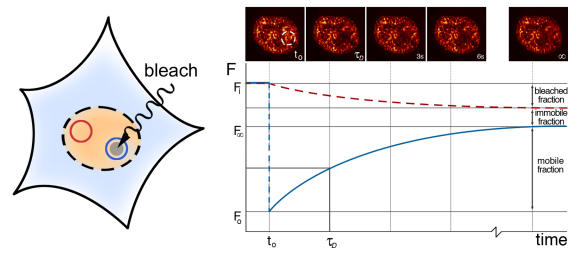
Figure 4. Fluorescence recovery after photobleaching (FRAP).
By bleaching the indicated (blue) region in the fluorescent area (here the nucleus of a cell expressing ERα fused to GFP) at time t0, fluorescence decreases from the initial fluorescence Fi to F0. The fluorescence recovers over time by diffusion. The characteristic diffusion time τD indicates the time at which half of the fluorescence has recovered. The mobile fraction can be calculated by comparing the fluorescence in the bleached region after full recovery (Fω) with the fluorescence in a distant region in the nucleus (red, dashed line).

