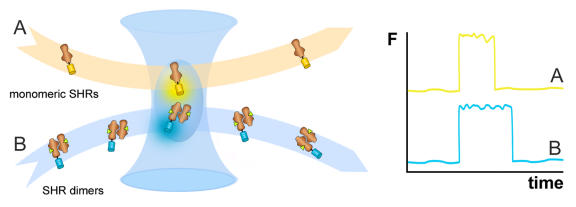
Figure 5. Fluorescence correlation spectroscopy (FCS).
By using the microscope objective lens to focus the laser beam, a diffraction limited excitation volume is created. The emitted fluorescence signal (F) from this observation volume fluctuates as labeled molecules diffuse in and out, and the duration of the fluctuations are related to the average time individual models reside within the volume. One such an event is depicted in the graph. The residence time can be used to determine the diffusion coefficient for the fluorescent molecules, which is dependent on their size and interaction with other proteins. For example, it can be used to discriminate monomeric Steroid Hormone Receptors (SHRs, A) from dimeric complexes (B).

