
Figure 1.
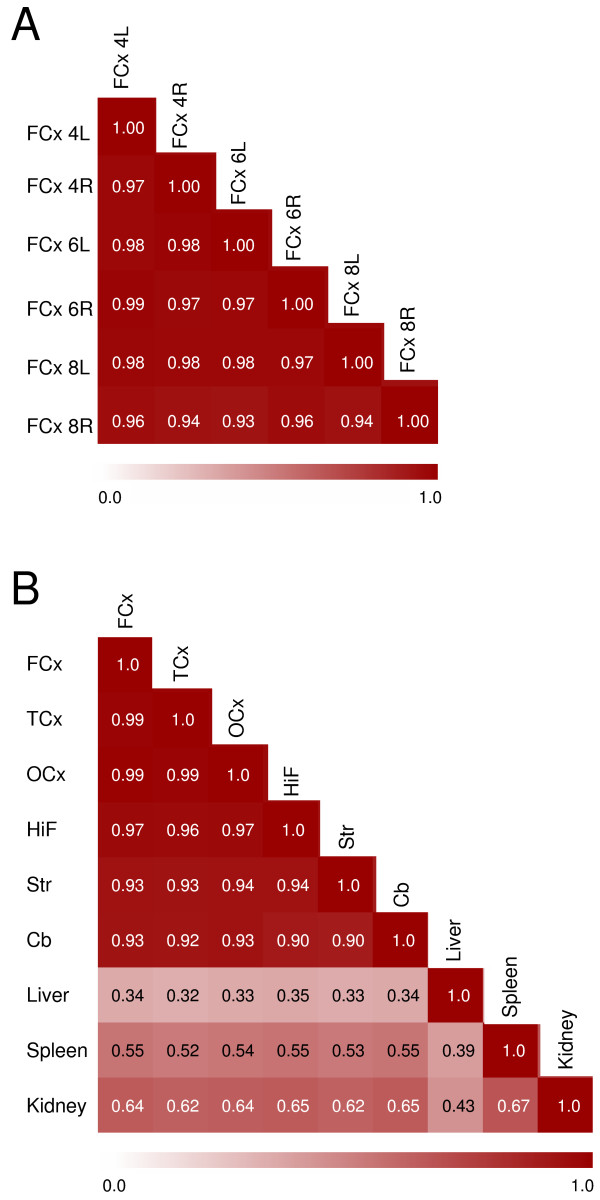
Correlations of rat tissue transcriptomes. a) Heat-map illustrating correlations between the six different samples from frontomedial cortex (left and right hemispheres) from the three different rats. b) Heat-map illustrating correlations in average gene expression across tissues and brain regions, all visualised by the Pearson correlation coefficient. Calculations were based on average signal intensities within each non-CNS tissue (3×) and brain region (6×). Red colour indicates the strength of the correlation, ranging from 0.0 (white) to 1.0 (dark red). Numerals (4,6,8) refer to the individual rats. L, left hemisphere; R, right hemisphere. FCx, fronto-medial cortex; TCx, temporal cortex; OCx, occipital cortex; HiF, Hippocampus; Str, Striatum; Cb, cerebellum.