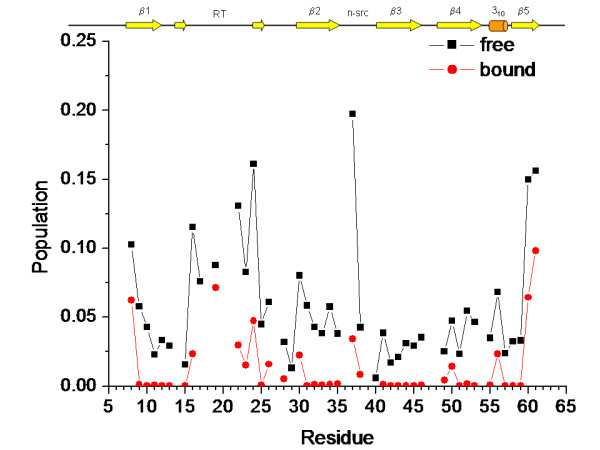
Figure 7.

The effect of p41 binding upon conformational flexibility in the R21A Spc-SH3 domain. The population of conformational states of the protein having each residue in a disordered, solvent-exposed conformation was calculated from the experimental HX rate constants as described in Methods. Black squares and red circles correspond to the free and bound forms, respectively. A cartoon showing schematically the location of the secondary structure elements is placed on top of the graph.
