
Figure 4.
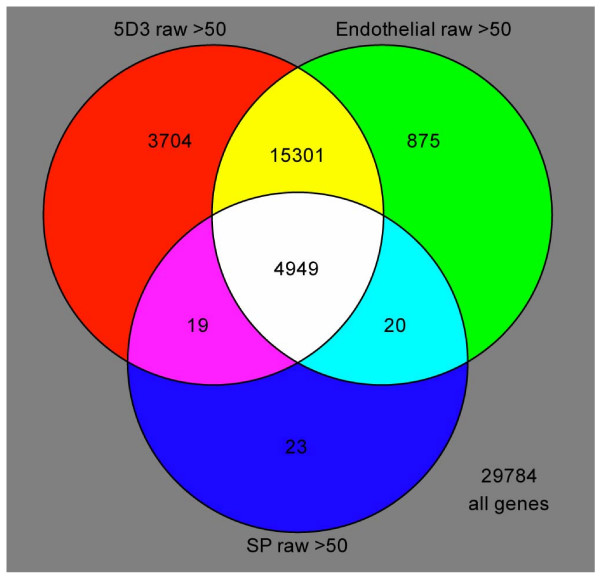
Overlap of prostate cell transcriptomes. The Venn diagram depicts shared genes expressed by each cell type: ABCG2+ (5D3) are red, endothelial (CD31+) are green, and SP are blue. Other colors show genes that are shared between the cell types, and white shows genes shared by all three.