Figure 7.
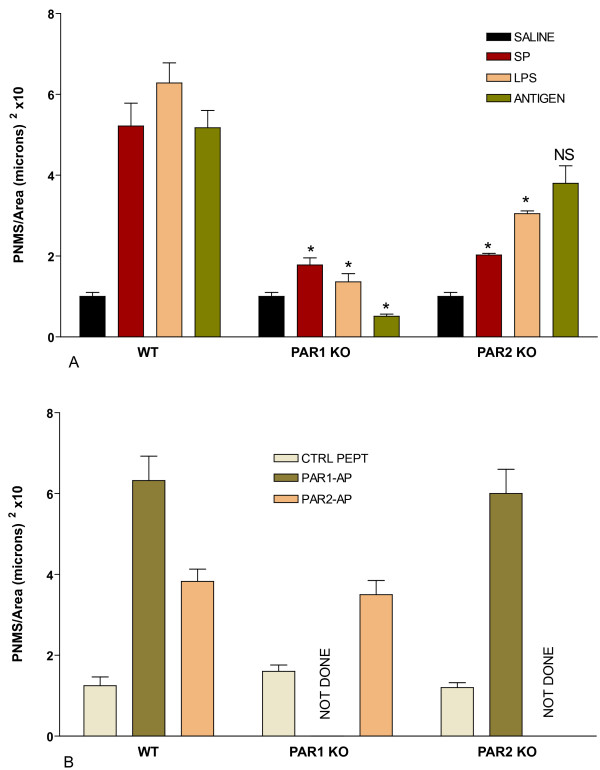
A-B. Comparison of the inflammatory responses (PMNs infiltration) obtained with wild type (C57BL/6J), PAR1-/-, and PAR2-/- mice. Responses were obtained 24 hours after bladder instillation with one of the listed substances. Figure 7A represents the response to substance P (10μM), Escherichia coli LPS strain 055:B5 (100 μg/ml), and DNP4-OVA (in sensitized mice; 1 μg/ml) compared to saline (black bars). Figure 7B represents the responses to PAR1-AP (10 μM) and PAR2-AP (10 μM) compared to control inactive peptide (10 μM). Number of mice = 6–8 per group. NS= not significant. Asterisks represent a statistically significant difference (p < 0.05) between the responses obtained with each pro-inflammatory stimuli in PAR1-/- or PAR2-/- and the respective response obtained in wild type mice.

