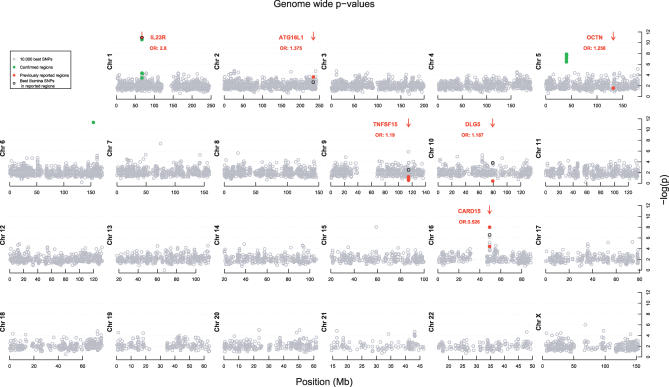
Figure 1. Results of the GWA for CD.
p-values (−log[p]) for the 10,000 best SNPs out of 302,451 are shown (gray circles). The position of previously described susceptibility loci are marked by red arrows. The p-values obtained in our cohorts with the reportedly associated SNPs/mutations are shown by the red dots, and the corresponding odds ratios are indicated. The p-values obtained with SNPs included in the Illumina panel ≤50 kb from these SNPs/mutations are marked by black circles. SNPs genotyped in the confirmation cohort are shown as green dots.

