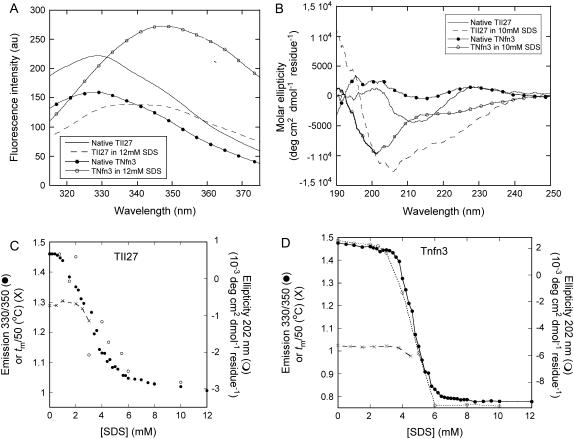
FIGURE 2.
(A) Fluorescence and (B) Far-UV CD spectra of TII27 and TNfn3 in the absence and presence of SDS. (C) Equilibrium denaturation of TII27 and (D) TNfn3 followed by fluorescence, CD, and changes in the melting temperature as a function of SDS concentration. For both proteins, tm has been divided by 50 to be compatible with the fluorescence axis.

