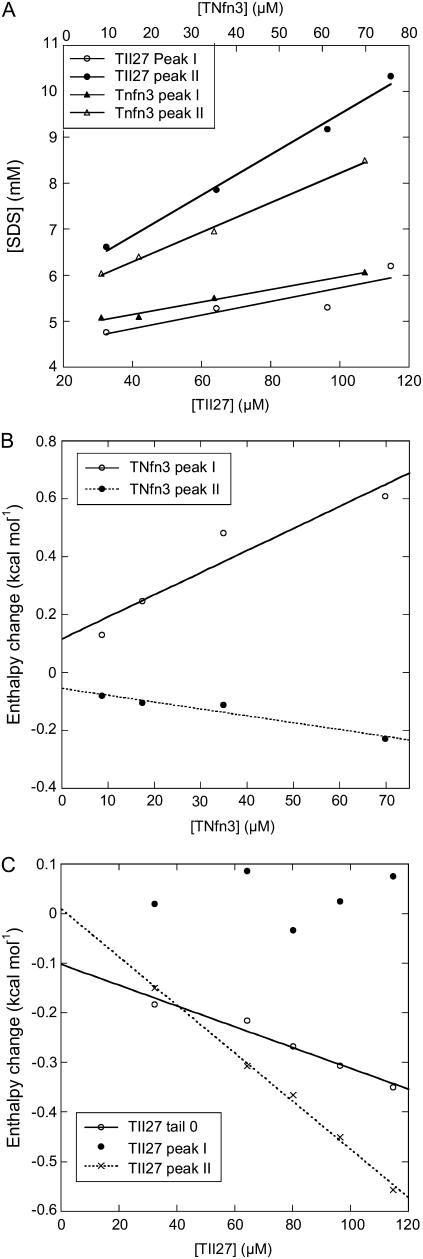
FIGURE 5.
(A) Concentrations at which peaks I and II appear for TII27 and TNfn3 as a function of protein concentration. (B and C) Enthalpy values at peaks I and II as well as in region A* (for TII27) as a function of protein concentration. Data are summarized in Table 1.

