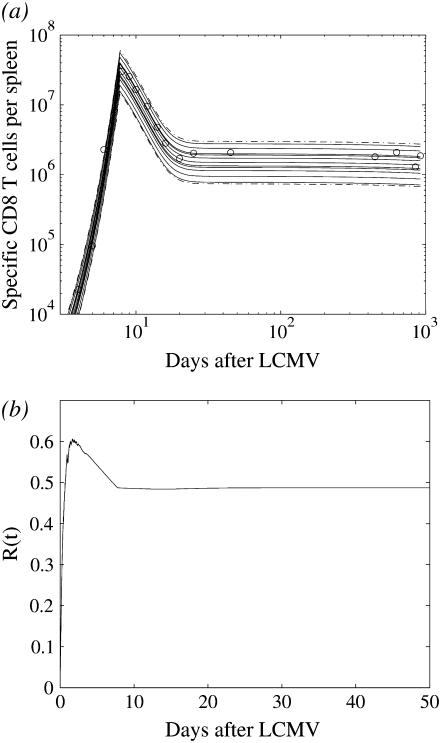
FIGURE 3.
Stochastic simulations of the acute response. (a) Ten simulation runs, each corresponding to the amount of CD8+ T cells in the spleen of one mouse (solid), 95% interval for the cell amount resulting from the 500 simulation runs (dashed). (b) R(t) is the ratio between the variance estimated from the 500 simulation runs and the variance estimated from the data.

