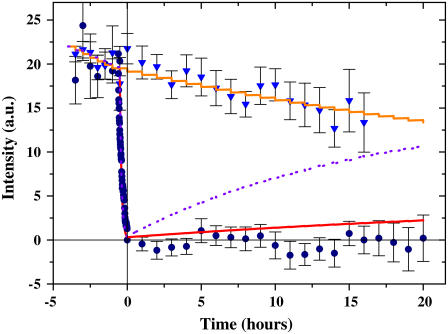
FIGURE 6.
Absence of exchange of ice-bound fluorescent antifreeze proteins after photobleaching. This graph shows the results from the FRAP experiments. The surface intensities of the bleached (circles) and unbleached (triangles) regions of crystals were calculated according to Eq. 3 and displayed as a function of time. Kinetic models of the recovery of the fluorescence signal after photobleaching with recovery periods of one day (purple line) and seven days (red line for bleached and orange line for unbleached) are also shown. Bleaching of 2% per observation is included in the model. The data were averaged over several crystals in four separate experiments. The number of crystals n at each time window was (0 ≤ t ≤ 14 h, 20 ≤ n ≤ 27), (5 ≤ t ≤ 14 h, 17 ≤ n ≤ 19), and (15 ≤ t ≤ 20 h, 9 ≤ n ≤ 14) for the bleached regions; and (0 ≤ t ≤ 10 h, n = 12), (11 ≤ t ≤ 14 h, 9 ≤ n ≤ 10), and (15 ≤ t ≤ 16 h, n = 2) for the unbleached regions.

