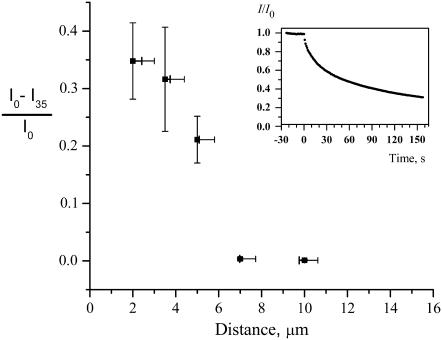
FIGURE 10.
Fraction of the fluorescence lost 35 s after the electroporation pulse versus cell-tip distance. Inset shows a typical fluorescence intensity change with time after electroporation (d = 3.5 μm, Vtot = 500 V). Error bars for the intensity represent standard error of the mean. The values on the distance axis corresponding to each point represent the length between cell and the capillary as seen in microscope images. The range along the distance axis corresponds to the best estimate of the range of true values of the distance. Because the capillary tip opening (3.6 μm) is of comparable size to the cell (10 μm radius), the distance measurement is somewhat subjective. When the capillary is at 45° with respect to the dish surface normal and beside the cell 5 μm above the surface of the dish (as in Fig. 3), there is actually a range of distances between the lumen and the cell membrane. The bar to the left is the shortest distance between the cell and the capillary. The bar to the right is the shortest distance between the cell and the center of the capillary opening.

