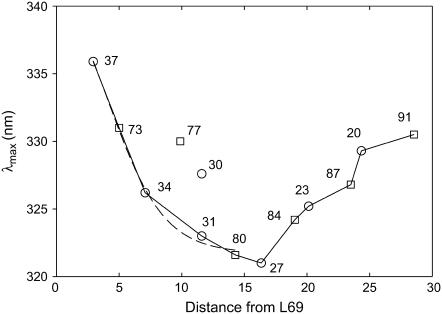
FIGURE 3.
Fluorescence emission maxima for Trp mutants of MscL. The figure shows fluorescence emission maxima for Trp mutants in M1 (○) and M2 (□) of MscL reconstituted into bilayers of di(C18:1)PC plotted as a function of the distance (Å) of the α-carbon of the residue from that of Leu-69, measured along the bilayer normal. The dotted line shows a fit of the data on the periplasmic side of the membrane to Eq. 5 describing a trough-like polarity profile in the membrane. As shown, fluorescence emission maxima for mutants L30W and I77W do not fit the general trends observed with the other mutants.

