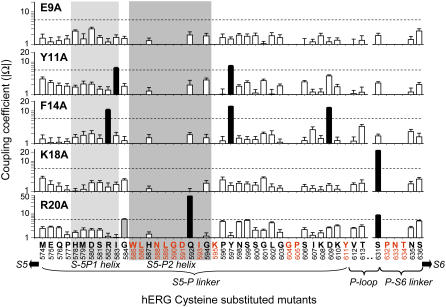
FIGURE 4.
Summary of absolute values of coupling coefficient (|Ω|) between 5 BeKm-1 alanine substituted mutants and 32 hERG cysteine substituted mutants. The BeKm-1 mutants are marked for each panel. The hERG native residues and position numbers are listed along the abscissa. The structural domains are also labeled. The high-impact positions are color coded red, and excluded from the analysis. Light gray shade denotes the putative S5-P1 helix that is stable during molecular dynamics simulation (see Fig. 7 B), whereas gray shade denotes the S5-P2 helix implicated by NMR spectroscopy. Dashed lines denote the cutoff |Ω| value of 5.4 (equivalent to a coupling energy of 1 kcal/mol). Histogram bars above the cutoff value are shown in black. G584 in the R20A panel is shown as a gray histogram bar because the coupling coefficient is marginally above the cutoff.

