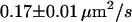
TABLE 2.
Summary of all experimental results obtained in this study
| T | till | CO | Dmacro | N | Color | |
|---|---|---|---|---|---|---|
| Fab-fragment | 37°C | 0.30 ms |  |
 |
150 | Green |
| Fab-fragment | 20°C | 0.65 ms |  |
 |
118 | Black |
| Full Ab | 37°C | 0.65 ms | 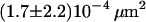 |
 |
132 | Red |
| Full Ab | 20°C | 0.65 ms | 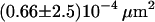 |
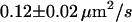 |
142 | Cyan |
| Full Ab | 20°C | 0.05 ms |  |
 |
191 | Blue |