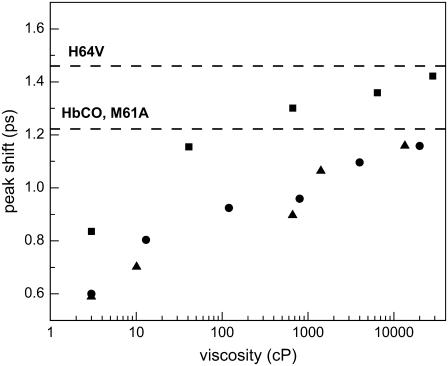
FIGURE 4.
The spectrally resolved vibrational echo peak shift as a function of viscosity for Tw = 2 ps. The data are for the 0–1 transition frequencies of H64V (squares), M61A (triangles), and HbCO (circles). As viscosity is increased, the peak shift approaches the infinite viscosity asymptotic value (shown as dashed lines) of the fructose sugar film. The viscosity dependence of the spectral diffusion (change in the peak shift with viscosity) is nearly identical for the three proteins.

