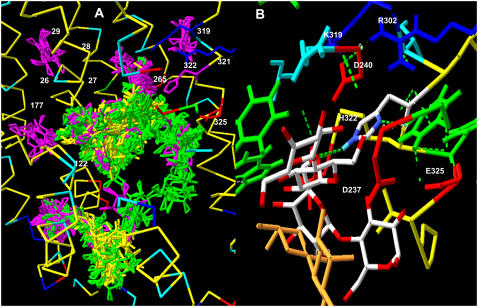
FIGURE 1.
(A) Slab view of LacY centered on the central pore, showing all the lactose (yellow), melibiose (green), and galactose (purple) docking sites on LacY. Superimposed numbers show the positions of mutations, which alter the sugar specificity of the transporter (Table 4). (B) The orange colored molecule shows TDG in the assigned position by crystallography (1) and two additional docked lactose molecules H-bonded to lactose H322 within the central cavity of LacY.

