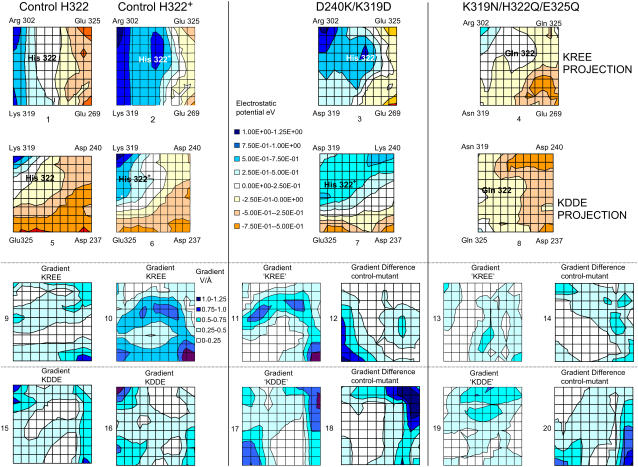
FIGURE 5.
Effects of protonation of H322 on the electrostatic charge distribution on the KREE and KDDE planes. A comparison of panels 2 and 6 with panels 1 and 5 shows the effects of protonation of His-322 in the KREE and KDDE planes, respectively. The color chart shows the potential scale: highest potential, 1.25 eV, lowest potential, 0.5 eV. Comparison of the electrostatic potential maps of control (protonated His-322) (panels 2 and 6), double mutant D240K/K319D (panels 3 and 7), and treble mutant K319N/H322/E325Q (panels 4 and 8). (Panels 1–4) KREE plane or equivalent. (Panels 5–8) KDDE or equivalent plane. (Panels 9–11, 13, 14–17, and 19) The electrostatic potential gradient maps are derived from the contour maps in panels 1–8, respectively, i.e., the potentials in the KREE and KDDE planes of the control and D240K/K319D double mutant and K319N/H322Q/E325Q triple mutant. (Panels 12 and 18) Differences obtained by subtraction of electrostatic potential gradient between control and D240K/K319D double mutant in the KREE and KDDE planes, respectively. (Panels 14 and 18) Difference maps between control gradients and triple mutant K319N/H322′/E325Q gradients in the KREE and KDDE planes, respectively, i.e., the gradient of the difference between panels 2 and 4 shown in panel 14 and the gradient of the difference between panels 5 and 8 shown in panel 20. The areas of white space in these difference maps indicate that there is no difference in the electrostatic potential gradients between control and mutant gradients.

