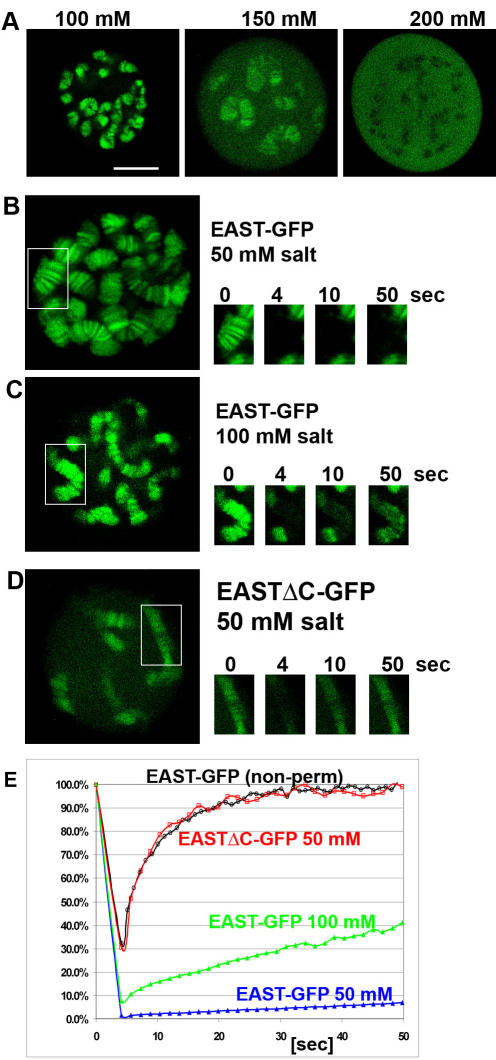
Figure 3. Characterization of EAST-GFP localization and mobility in larval salivary glands.
(A) Varying the salt concentration can modulate localization of EAST-GFP. At 100 mM, the distribution is mostly chromosomal, at 150 mM chromosomal and nucleoplasmic and at 200 mM no chromosomal-like pattern is detectable. (B-D) The mobility of EAST-GFP was assessed by FRAP. (B, C) Increasing the salt concentration lowers the affinity to chromatin. An increase in salt from 50 mM (B) to 100 mM (C) leads to a faster recovery of fluorescence after bleaching chromosome regions bound by EAST-GFP. (D) Removing the C-terminal residues 1535-2301 of EAST leads to an increase in mobility. At a salt concentration of 50 mM, the truncated version of EAST associates with a lower affinity than the full-length version. (E) The diagram shows the recovery in seconds after bleaching the indicated nuclear regions for 4 seconds at a laser intensity of 100%. The two different variants of EAST-GFP were expressed using the ftz-GAL4 driver. Cells were permeabilized in buffers containing 50 mM NaCl supplemented with varying amounts of KCl to reach the indicated salt concentrations. The recovery of the non detergent treated cell (non-perm) in Figure 1A is indicated for comparison. The Bar in A represents 10 µm and applies to all panels.

