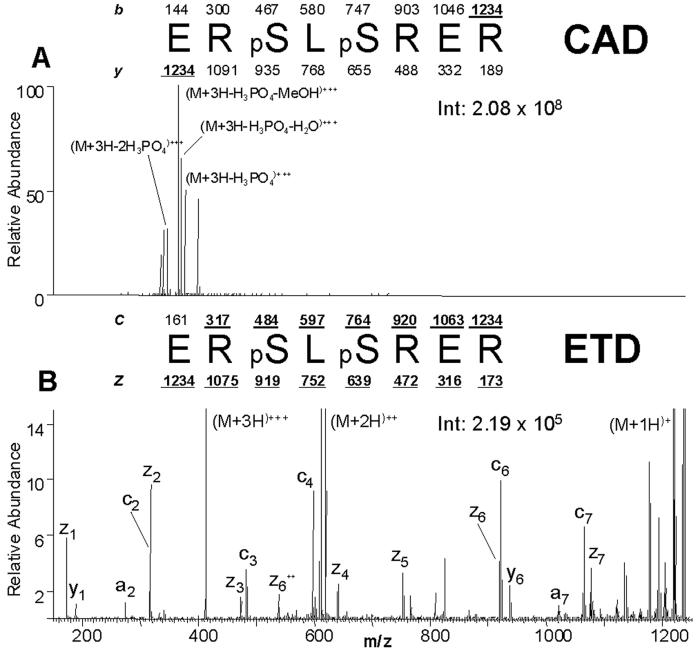
Figure 3.
Comparison of CAD vs. ETD spectrum of a phosphorylated peptide
Consecutive single-scan CAD vs. ETD mass spectrum comparison of phosphorylated peptides generated from a tryptic digest of human nuclear proteins recorded during a data-dependent analysis (nHPLC-μESI-MS/MS). All peptides were converted to methyl esters and enriched for phosphorylated peptides by immobilized metal affinity chromatography before analysis. (A) CAD spectrum dominated by fragment ions corresponding to the loss of phosphoric acid and either methanol or water. (B) ETD spectrum containing a near complete series of c- and z-type product ions. Note that the spectrum is devoid of fragment ions corresponding to the loss of phosphoric acid [12] Copyright (2004) National Academy of Sciences, USA. Reprinted with permission.

