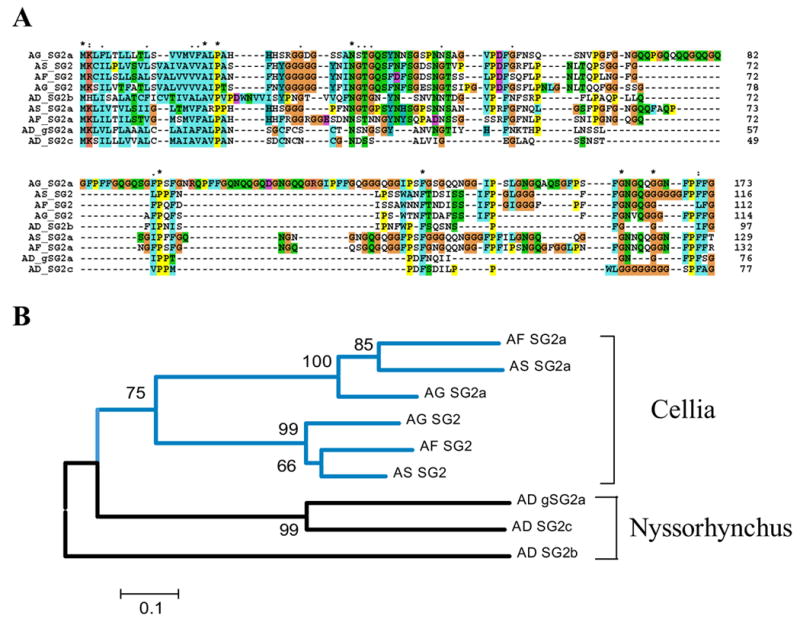
Fig. 2.

(A) Clustal alignment of the unique SG2 family of anopheline salivary peptides. The sequences shown are from An. darlingi (AD), An. stephensi (AS), An. funestus (AF), and An. gambiae (AG). (B) Neighbor-joining phylogram. The numbers in the phylogram nodes indicate percent bootstrap support for the phylogeny. The vertical bars show the Cellia and Nyssorhynchus subgroups. The bar at the bottom indicates 10% amino acid divergence in the sequences.
