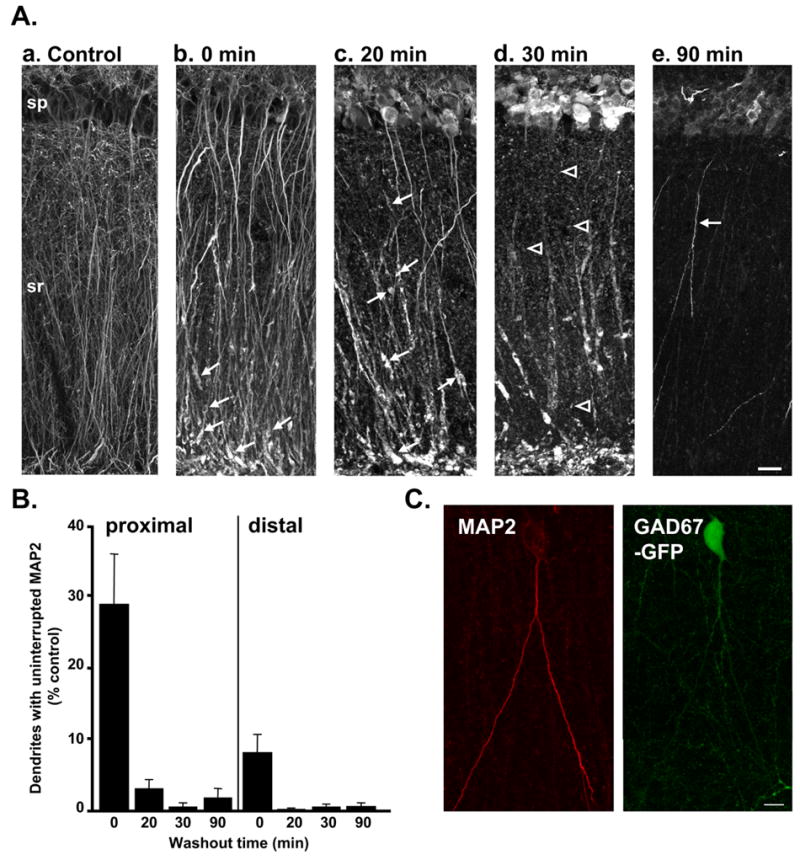
Figure 2. NMDA exposure initially produced irregular dendritic swelling followed by progressive loss of dendritic MAP2.

A: Representative photomontages illustrate distribution of MAP2 in a control slice (a) and in slices fixed at various timepoints (0–90 min, b–e) following transient NMDA exposure (30μM, 10 min). Dendrite swelling and loss of MAP2 labeling from fine dendritic processes was observed immediately following NMDA exposure (b). Irregular swelling and fragmentation of MAP2 labeling initially was most evident in distal apical dendrite segments (arrows in b), but by 20 min post-NMDA was also observed throughout sr (arrows in c). Most MAP2 labeling was punctate by 30 min (arrowheads in d); by 90 min post-NMDA, punctate MAP2 labeling was generally undetectable throughout dendritic regions, and brightly labeled dendrites were seen only in a very small number of neurons (arrow in e). In pyramidal cell bodies (sp), MAP2 increased over 20–30 min. Scale bar (20μm) applies to all panels. B: Mean data showing the number of continuously labeled dendrites (measured in a 20μm analysis window) in proximal (left) and distal (right) regions of sr. There was a significant loss of dendrites with continuous MAP2 labeling immediately following NMDA exposure (0 min) in both regions (p<0.01, compared with control). 20–90 min post-NMDA, there were very few dendrite segments with uninterrupted MAP2 labeling in either region (p<0.001, compared with controls n=4–6 for each condition). C: Example of a neuron with preserved dendritic MAP2 labeling (left panel) 90 min post-NMDA in a slice from a GAD67-GFP animal. The GFP fluorescence in this neuron (right panel) suggests that this is an interneuron. Scale bar: 10μm.
