
Figure 1.
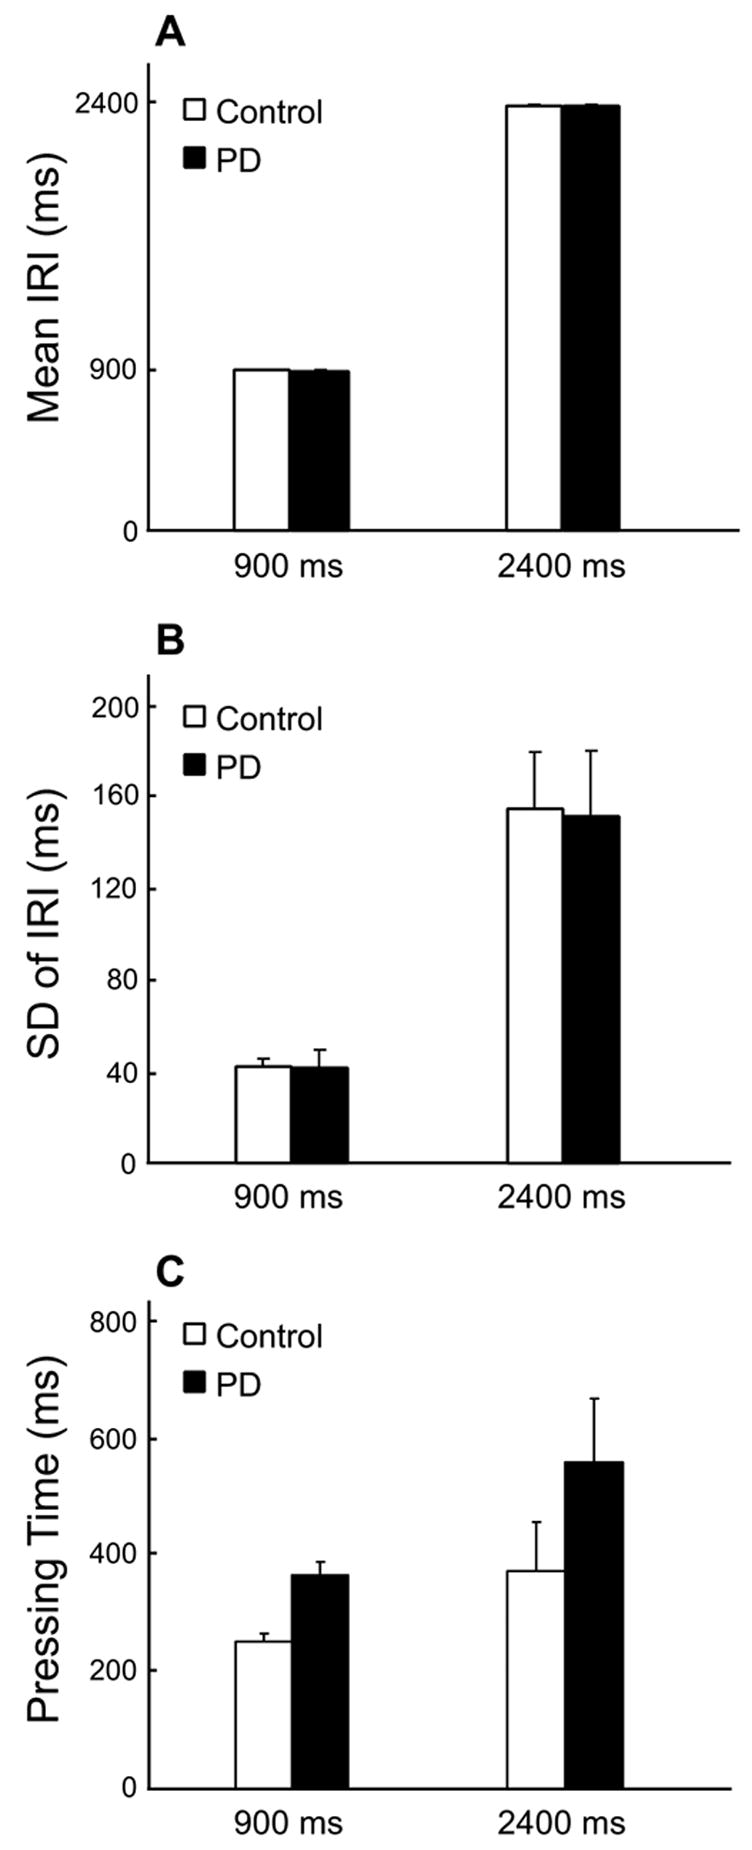
Behavioral performance for PD patients and healthy individuals. A) Mean IRIs for the 900 ms and 2400 ms conditions. The mean IRIs did not significantly differ between patients and controls in either 900 ms or 2400 ms conditions. B) The standard deviations of IRI for the 900 ms and 2400 ms conditions. C) The mean time period that subjects pressed the button with their thumb during 900 ms and 2400 ms conditions. The error bars represent the standard error between subjects. Similarly, there was no significant between-group difference in either condition. The standard deviation increased from 900 ms to 2400 ms condition in both patient and healthy group (p < 0.0001).