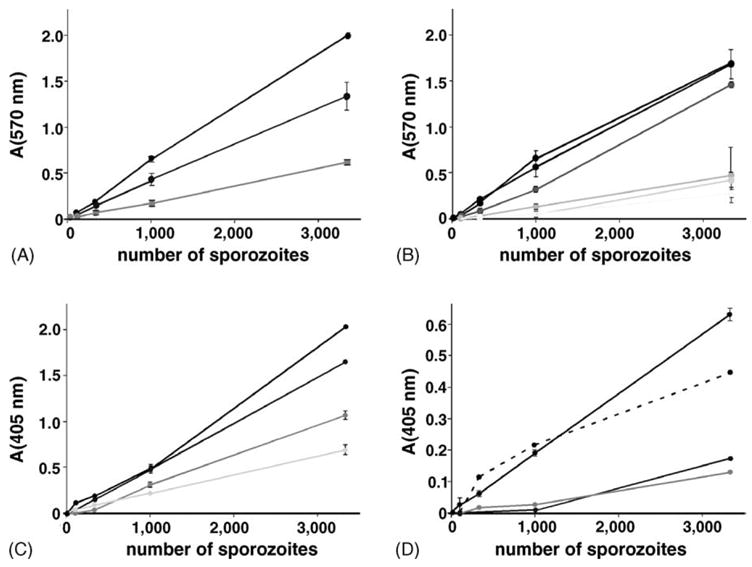
Fig. 4.

Quantification of transgenic sporogonic and pre-erythrocytic stages. (A) Quantification of isolated oocyst sporozoites with the β-D-galactopyranoside analog CPRG (absorption at 570 nm). Shown are titration curves from three independent feeding experiments (black, dark grey and light grey). (B) Quantification of salivary gland sporozoites. Shown are mean values with standard deviations from duplicate measurements of six independent feeding experiments (black to light grey). (C and D) β-galactosidase ELISA to quantify infected hepatocytes. Shown are β-galactosidase levels (absorption at 405 nm) of infected hepatocytes 15 h (C) or 48 h (D) after addition of PbBlue sporozoites. Sporozoites were dissected at day 17 (lines) or day 19 (dashed line) post-infection. Liver stage development was done from at least three independent feeding experiments (black to light grey). Shown is the mean with standard deviations of duplicates.
