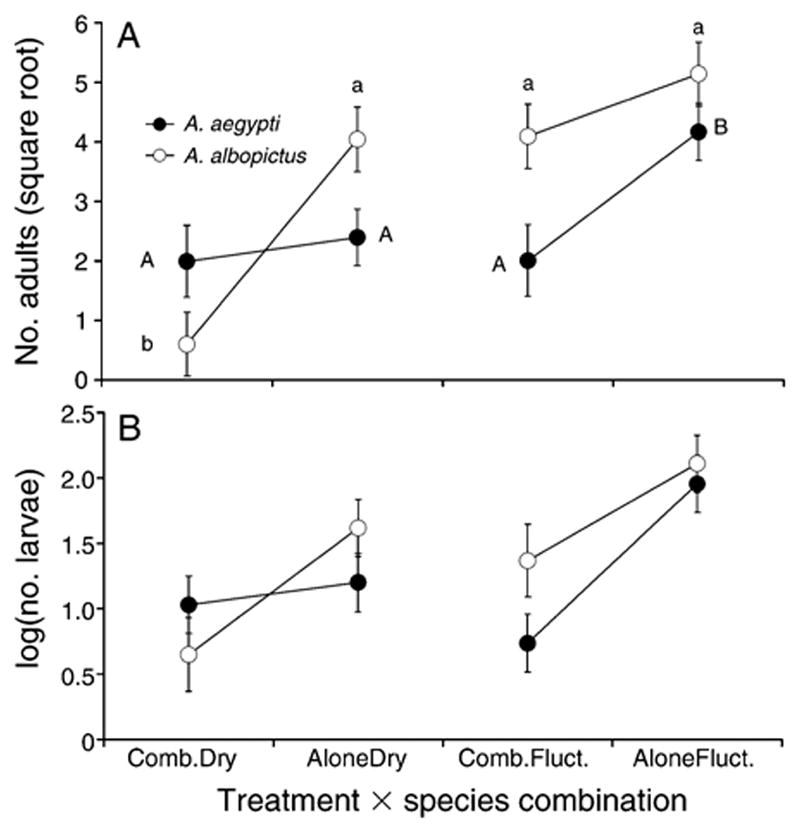
Fig. 1.

(A) Number of adults (mean ± SE) of Aedes aegypti and A. albopictus across species × treatment combinations. (B) Log-transformed number of larvae (mean ± SE) of A. aegypti and A. albopictus across species × treatment combinations. Combination cages where both species were present are indicated by “Comb.,” and cages where species were alone are indicated with “Alone.” “Dry” indicates drying treatments and “Fluct.” indicates fluctuating treatments. Significant differences (P < 0.05) in pairwise comparisons are indicated by uppercase letters for A. aegypti and lowercase letters for A. albopictus.
