
Figure 3.
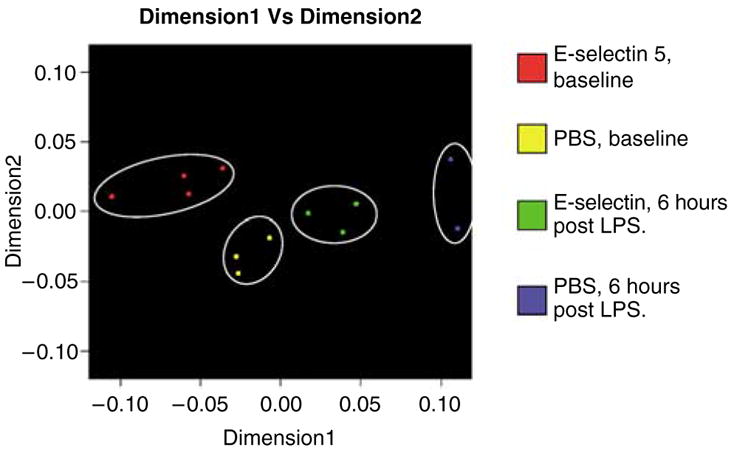
Multidimensional scaling analysis after analysis of variance (ANOVA) analysis of the brain at baseline and at 6 h post lipopolysaccharide (LPS) for phosphate-buffered saline (PBS) and E-selectin (5 μg) treatment groups. Differences in the aggregate expression of brain genes among the treatment groups were showed with genes shown to be differently expressed at P < 0.005 by ANOVA analysis.