
Figure 4.
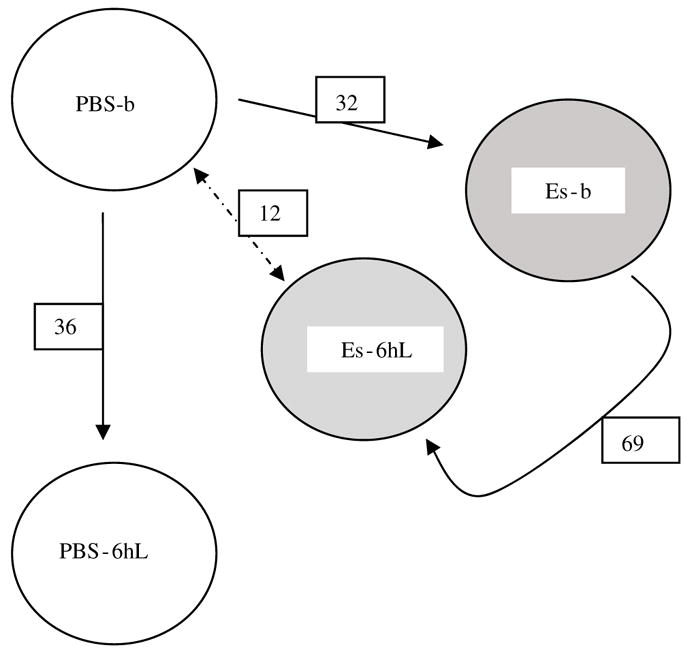
Numbers of differentially expressed genes in the brain compared among study groups. The gene expression differences of the brain were compared between the PBS-b (phosphate-buffered saline group at baseline) group and other treatment groups to show the numerical transcript differences induced by E-selectin tolerization and lipopolysaccharide (LPS) challenge. PBS-b, PBS 6 h after LPS (PBS-6hL), E-selectin at baseline (ES-b), and E-selectin 6 h after LPS (Es-6hL).