
Figure 5.
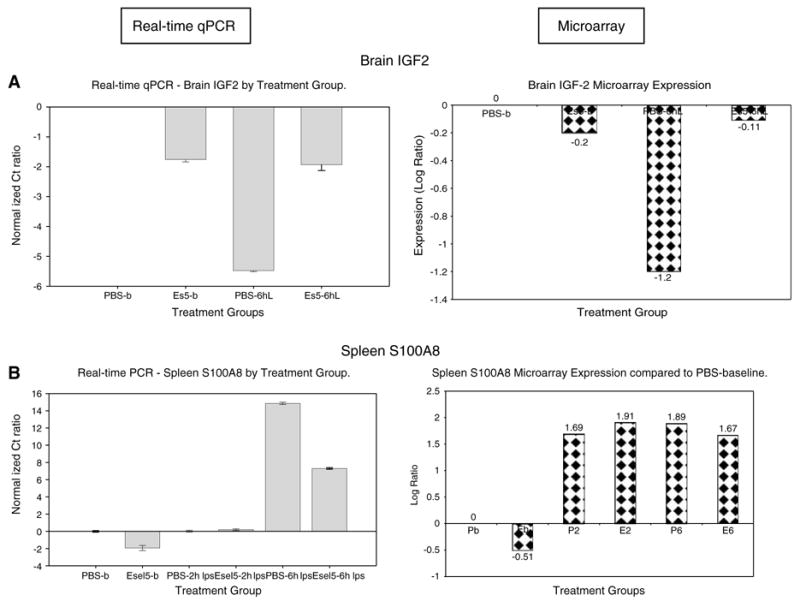
Real-time quantitative polymerase chain reaction (qPCR) and microarray expression of selected genes in brain insulin-like growth factor (IGF)2 (A) and spleen S100A8 (B). The gene expression patterns of the selected genes were examined using real-time qPCR and compared with patterns from the microarray profiling. The expression for each treatment group is shown relative to the PBS-b group.