
Figure 6.
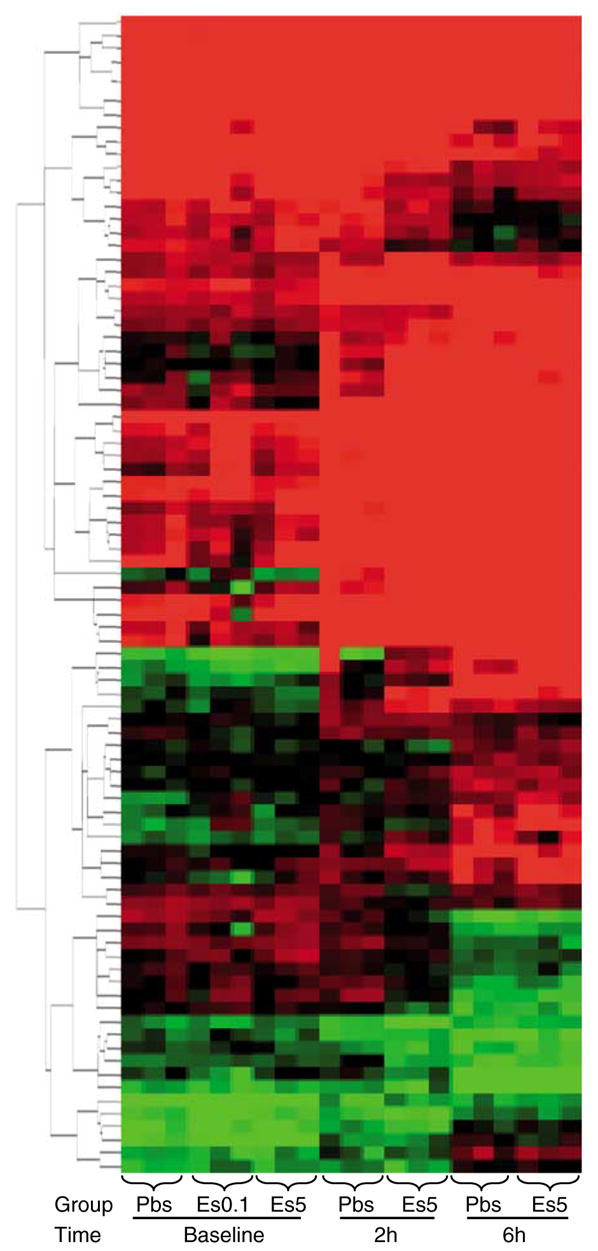
Spleen arrays of all groups (at baseline, at 2 h, and at 6 h post lipopolysaccharide (LPS)), hierarchical clustering by Euclidean distance of 88 differentially expressed genes at P < 0.0001. Differences in clustering of splenic genes by treatment group were showed after the one-way analysis of variance (ANOVA) analysis.