
Figure 1.
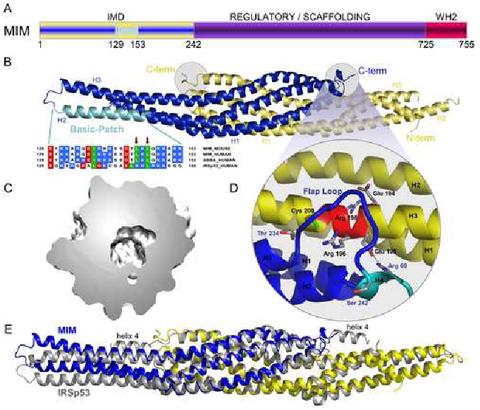
Crystal structure of the IMD of mouse MIM. (A) Schematic representation of MIM (yellow/blue, IMD; purple, middle regulatory/scaffolding region; red, WH2). (B) Ribbon representation of the structure of the IMD dimer (figure made with the program PyMOL, http://www.pymol.org). The two subunit of the dimer are colored blue and yellow. Helices 1 to 3 of each subunit are labeled H1, H2 and H3. Also shown is a sequence alignment corresponding to the conserved basic cluster at the symmetric ends of the IMD dimer (highlighted cyan in one of the subunits of the structure). In this alignment, red, blue, and green represent negatively charged, positively charged, and hydrophobic conserved amino acids, respectively. Accession numbers are: MIM_MOUSE, Q8R1S4; MIM_HUMAN, O43312; ABBA_HUMAN, Q765P7; IRSp53_HUMAN, Q9UQB8. Red arrows point to amino acids Leu 145 and Leu 147, which were mutated in this study. (C) Slice cut through the middle of the molecular surface of the IMD dimer revealing the interior cavity. (D) Close-up view of the “flap” loop between helices 3 and 4 that covers the “signature sequence” (Yamagishi et al., 2004) of the IMD, which is a charged and conserved sequence that is buried in the structure (red colored area of helix 3). (E) Superimposition of the structures of the IMDs of MIM and IRSp53. The two structures were superimposed based on the best overlapping central region (amino acids 26-68, 72-110 and 24-66, 69-107 of both chains of MIM and IRSp53, respectively). The view is as in part B and figure 3. This orientation highlights the differences between the A chains of the two proteins (blue). Although not well seen from this angle, similar differences occur between the B chains (yellow). Notice that helix 4 of the IMD of IRSp53 is missing in MIM.