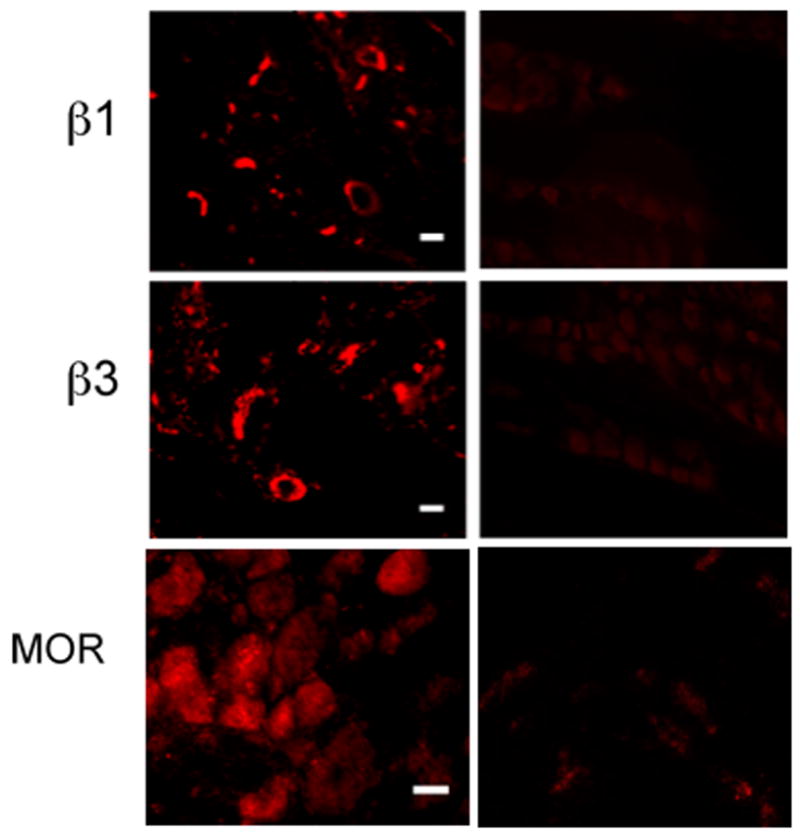
Figure 1.

Immunohistochemistry of trigeminal ganglia sections. Left column shows the localization of the immunoreactive integrin subunits β1 and β3 at 20x and MOR at 10x in rat trigeminal ganglia revealed by IHC methods using fluorophore tagged antibodies. The scale bars represent 10 microns. The right column shows background staining (negative controls) using heat denatured primary antibodies for the integrins and a blocking peptide for MOR as detailed under Methods.
