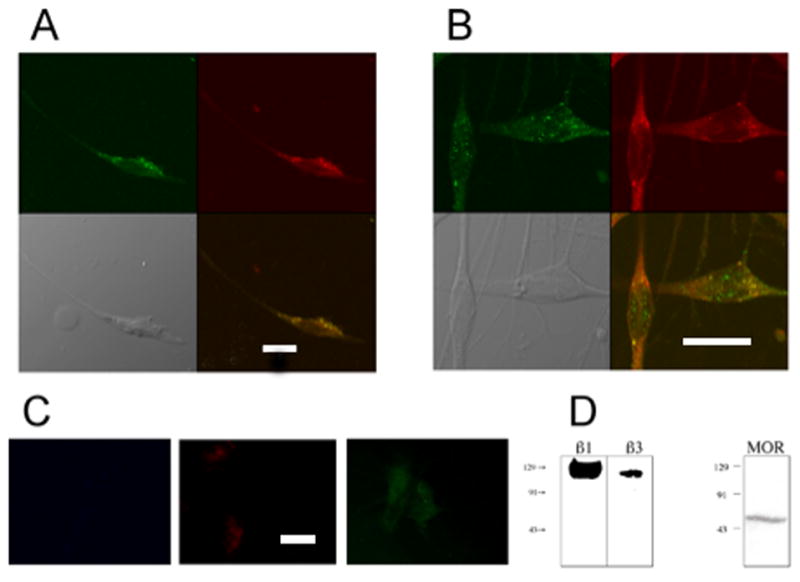
Figure 2.

Colocalization of β1 and β3 integrin subunits with MOR. Colocalization of β1 or β3 integrin subunits (green cells, panels A, B, respectively) with MOR (red cells, panels A, B) in cultured rat trigeminal ganglion neurons (fifth day in culture) was examined using ICC methods with confocal imaging. Panels were acquired in sequential single wavelength channels to eliminate bleed through fluorescence. Colocalization is indicated by the yellow color seen in the neurons in the bottom right image in Panels A and B. Panel C shows fluorescence controls for β1, MOR and β3 acquired as described in the legend to fig 1. Scale bars in figs A and C are 10 microns, while that for fig B is 20 microns. Both β1 (A panels) and β3 (B panels) integrin subunits colocalized with MOR in cultured neurons (MOC 0.76 and 0.85, respectively). Western blot analyses (D) confirm expression of β1 (115 kDa), β3 (105 kDa), and MOR (60 kDa) by cultured trigeminal ganglion neurons.
