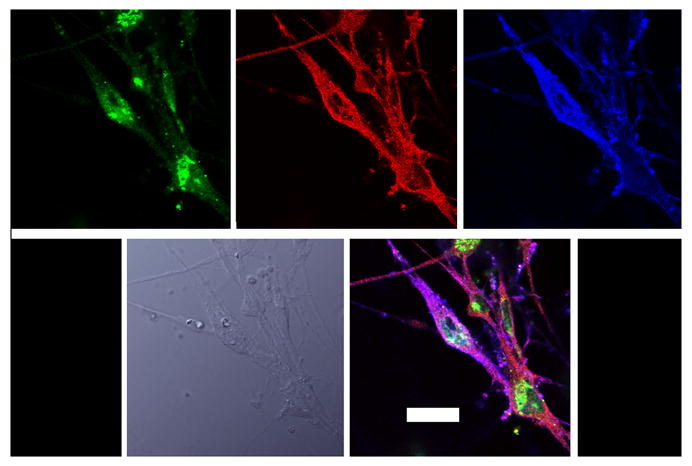
Figure 3.

Colocalization of β1 and MOR with phosho-Pyk2. Cultured rat trigeminal ganglion neurons prepared as described in Methods were probed by conventional ICC methods with antibodies against β1 (blue) MOR (green) and p-Pyk2 (red)- in top row. The bottom left picture is a bright field image, and colocalization of all three proteins is indicated by the pink color in the bottom right panel. All confocal images were obtained at 60x in sequential channels, to eliminate fluorescence bleed through. The scale bar represents 10 microns.
