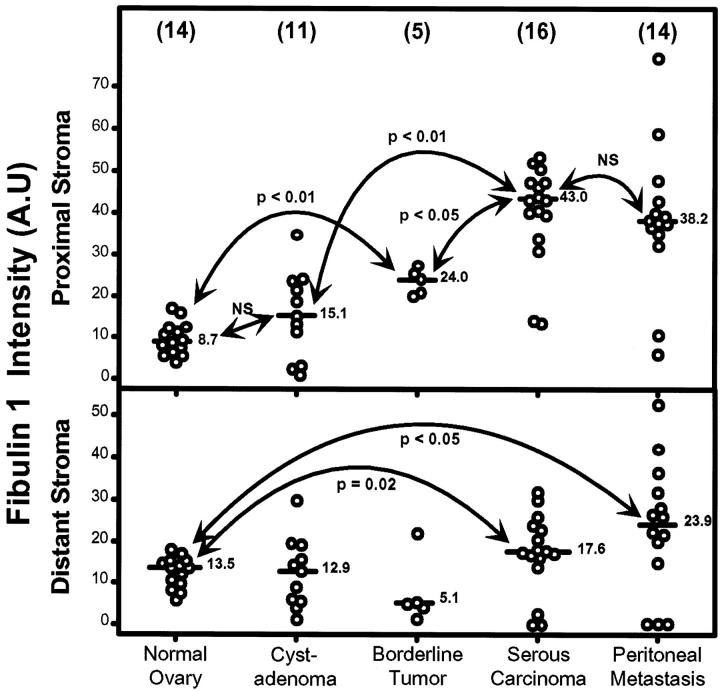
Figure 5.
Fibulin-1 staining intensity quantification in arbitrary units (A.U.) in proximal stroma (upper) and distant stroma (lower) of normal ovaries, serous cystadenomas, borderline tumors, carcinomas, and corresponding peritoneal metastases. P values were determined according to the nonparametric Wilcoxon-Mann-Whitney test. Bar, median value. Number of different samples is shown in parentheses.

