
Figure 1.
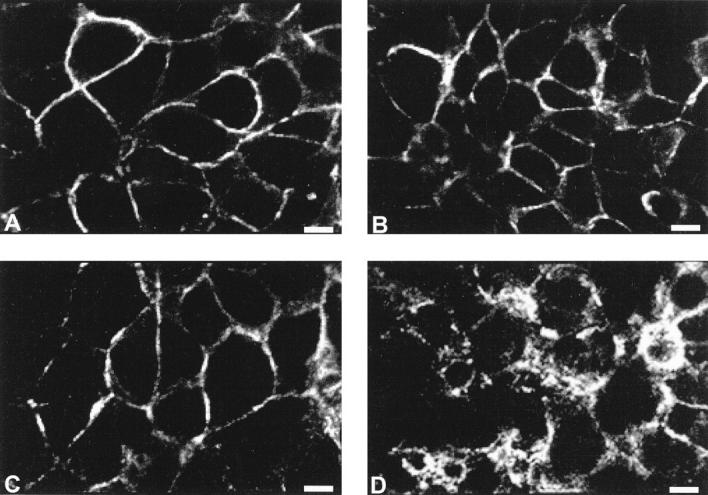
Spatial distribution of E-cadherin and catenins in human bronchial cell lines by confocal microscopy. Ephithelioid noninvasive 16HBE cells displayed a strong membranous E-cadherin (A), α-catenin (B), and β-catenin (C) expression pattern. However, only β-catenin was expressed in highly invasive BZR cells, where it was distributed in a spotty cytoplasmic pattern (D). Scale bar = 11 μm.