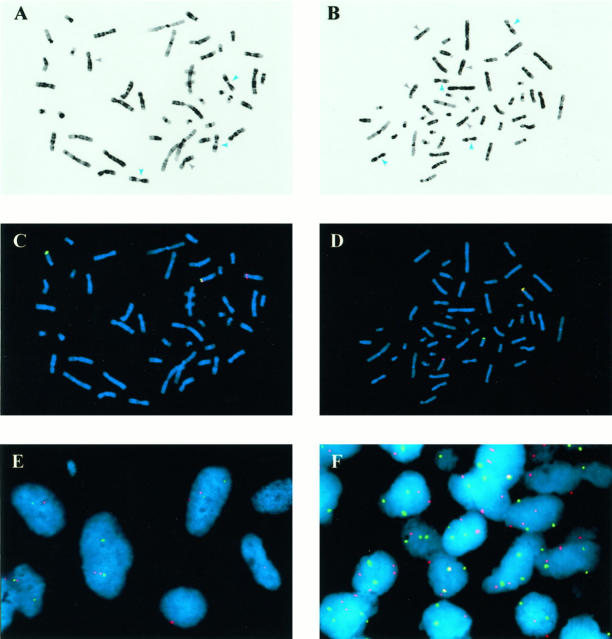
Figure 2.
Molecular cytogenetic analyses of CMN and CFS. A and B: Giemsa emulations are derived from DAPI-stained metaphase cells of CMN 3 (A) and CFS 3 (B). Gray and blue arrows indicate chromosome 8 and 11 homologs, respectively. CMN 3 has disomy 8 and trisomy 11; CFS 3 has tetrasomy 8 and tetrasomy 11. C and D: ETV6-region FISH for the same metaphase cells shown in A and B. The t(12;15) translocations are revealed by splitting of the centromeric (rhodamine detection is red) and telomeric (FITC detection is green) ETV6-region FISH probes. E: ETV6-region FISH in 4-μm section from CMN 3. Several nuclei in center of field show wide splitting of the centromeric (red) and telomeric (green) components of the FISH probe. F: Chromosome 8 (rhodamine is red) and 11 (FITC is green) FISH in 4-μm paraffin section from CMN 3. Several nuclei show two copies of chromosome 8 and 3 copies (trisomy) of chromosome 11.

