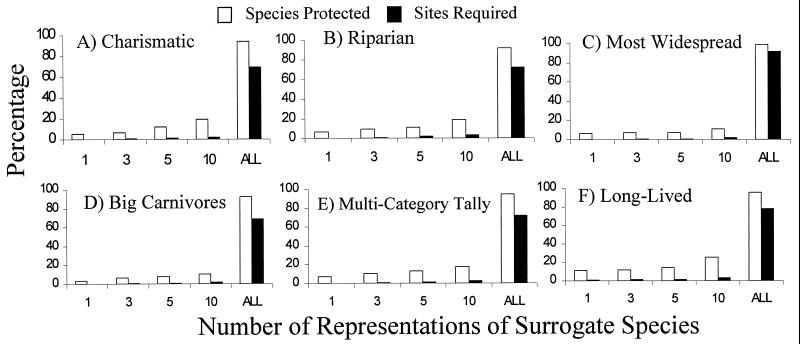
Figure 4.
Percentage of species protected and percentage of sites required if 1, 3, 5, 10, or all populations of surrogate species are protected for top-performing surrogate sets using the national Environmental Protection Agency endangered species by county database. “ALL” results are from Fig. 1; sites were chosen as in Fig. 2.

