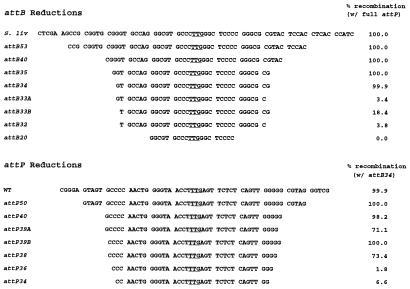
Figure 3.
Minimal sizes of attB and attP sites. The right column shows the percentage recombination obtained in the intramolecular integration assay in E. coli when the illustrated shortened versions of φC31 attB (Upper) and attP (Lower) were tested. The name of each site tested corresponds to the length of the att site in base pairs. B33A and B33B indicate sites where the reduction of the site length from 34 bp to 33 bp occurred at the right or left ends of the site, respectively. Similar nomenclature is used for P39A and P39B. full attP, full-length attP.

