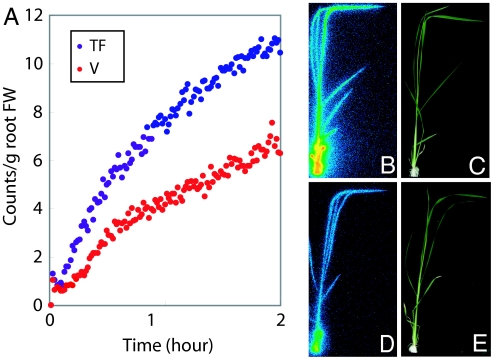
Fig. 3.
Uptake and transport of Fe as monitored by using PETIS. (A) Relative Fe-transition rate of transformant (TF; line 7) and vector control (V) in stem. (B) Bio-Imaging Analyzer System (BAS Bioanalytical Systems) image of the transformant. (C) Photograph of the transformant. (D) BAS Bioanalytical Systems image of the vector control. (E) Photograph of the vector control. Colors from blue through green, yellow, orange, and red indicate increasing Fe uptake in B and D.

