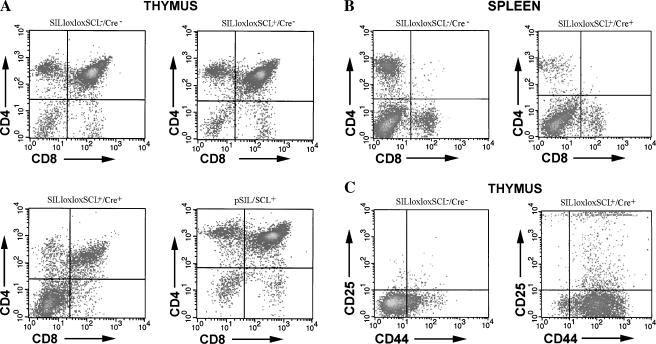
Figure 5.
FACS profiles demonstrating aberrant T-cell development. Thymocytes (A) and splenocytes (B) from clinically healthy mice with the indicated genotype were stained with CD4 and CD8. Note the increased DN population in the SILloxloxSCL+/Cre+ thymocytes, and decreased SP population in SILloxloxSCL+/Cre+ splenocytes. (C) Thymocytes from above mice were stained with CD44 and CD25; note increased CD44+CD25- population in SILloxloxSCL+/Cre+ sample.

